Reference no: EM131018091
Thanksgiving Handout
- The purpose of this handout is to provide a variety of problems illustrating many of the ideas that we have discussed in class this semester.
- The questions are presented chronologically and thus, some questions at the end of the handout may not have been covered in class yet.
- Please work these problems and review the ideas embedded in each as a preparation for the final exam in December.
1. Positive vs Normative
Identify which of the following statements are the positive(P) and which are normative(N):
a. The earth is flat.
b. The government should levy a tax on beer because the tax will decrease the consumption of beer, and in turn, the deaths from drunk driving.
c. An economic model is a framework that aids in understanding some part of economic reality.
d. The unemployment rate is 6%.
e. The government should take action to be sure that the unemployment never exceeds 6%.
2. Opportunity Cost and PPF
Suppose Australia and New Zealand each have 100 acres of land available for farming of wheat and cotton. Yields per acre are listed in the table below:
|
|
New Zealand
|
Australia
|
|
Wheat
|
12 bushels
|
4 bushels
|
|
Cotton
|
4 bales
|
12 bales
|
a. Graph the PPF for each country.
b. Which country has comparative advantage in wheat production? In cotton production? Which country has absolute advantage in wheat production? In cotton production?
c. Suppose New Zealand and Australia are consuming and producing 480 bushels of wheat and 240 bales of cotton, and 240 bushels of wheat and 480 bales of cotton respectively. Explain how both countries could be made better off by trading.
3. Excise Tax
Suppose the market demand for movie tickets (in millions per year) is given by the equation QD = 10 - P (market demand) while tickets are supplied according to
QS = P - 2 (market supply).
a. Solve for the equilibrium price and quantity numerically. Graph the market demand and the market supply and show the equilibrium on the graph.
b. Suppose the government imposes an excise tax on movie tickets of $2 per ticket. Graph the new situation. Show the areas that correspond to tax revenues, consumer tax incidence, and producer tax incidence.
c. Calculate the after-tax equilibrium price and quantity, the net price received by sellers, tax revenues, consumer tax incidence, producer tax incidence, and the dead-weight loss.
4. Market Demand and Supply
There are 10 police officers working in a small town. Each has daily demand for
doughnuts given by the equation
QD = 8 - 10P . Since there is no doughnut shop in the town one of the dispatch workers, Ed, makes and sells doughnuts to the officers.
a. Graph the individual demand curve. Graph the market demand curve.
b. Write an equation for the market demand.
c. Suppose Ed's supply can be described by the equation QS = 60P . What is the equilibrium price of doughnuts? What is the equilibrium quantity of doughnuts? How many doughnuts does each officer buy each day?
5. Demand and Supply
Suppose the market for orange juice is initially in equilibrium. For each case described below, draw a graph that shows this initial equilibrium, and the effects of that case on the market. Consider each case separately.
a. There is a sharp reduction in the supply of orange due to bad weather conditions.
b. There is a sharp reduction in the supply of grapefruit due to bad weather conditions.
c. Incomes of consumers of orange juice rise.
d. It is announced that orange juice prevents cancer.
e. Consider case (a) and case (c) together.
6. Agricultural Programs
The following graph shows the market for wheat.
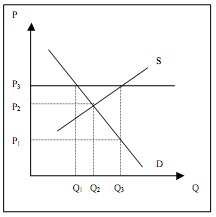
a. Suppose the government decides to have a price support program with a price floor set at P3. Discuss the implications of this program. More specifically, consider the new price that will prevail in the market after the implementation of the program and the quantity sold in the market. What is the cost of this program to the government? What are the disadvantages of the support program?
b. Suppose instead, the government decides to have a price subsidy program with a guaranteed price of P3. Discuss the implications of this program. More specifically, consider the new price that will prevail in the market after the implementation of the program and the quantity sold in the market. What is the cost of this program to the government?
7. Elasticity
The 1 elasticity of demand shows the responsiveness of quantity demanded to a change in the own price. This can be calculated by dividing the percentage change in the 2 by the percentage change in the 3 . In addition, the point elasticity formula is given by 4 which is used to calculate the price elasticity of demand 5 on the demand curve. The arc elasticity formula is given by 6 and it is used to calculate the price elasticity of demand 7 on the demand curve. The price elasticity of demand can never be 8 because of the law of demand. When it is between 0 and -1, the demand is 9 . When it is exactly equal to -1, the demand is 10 . When it is less than -1, the demand is 11 . All linear demand curves have 12 portion, 13 point, and 14 portion. With such a demand curve, the 15 point is the mid-point of the curve.
The price elasticity of demand and total revenues are related in the following way. In the 16 portion of the demand curve, since the quantity demanded is very responsive to price changes, when price is increased, total revenues will go 17 . On the contrary, in the 18 portion of the demand curve where the quantity demanded is not very responsive to price changes, when price is increased, total revenues will go 19 . If total revenues stay the same in response to a price change, then we must be at the 20 point on the demand curve.
The 21 elasticity of demand shows the responsiveness of quantity demanded of good X to a change in the price of good Y. It can be calculated by dividing the percentage change in the 22 by the percentage change in the 23 . If it is negative, then good X and good Y are 24 . If it is positive, then good X and good Y are 25 .
The 26 elasticity of demand shows the responsiveness of quantity demanded to a change in income. It can be calculated by dividing the percentage change in the 27 by the percentage change in 28 . If the income elasticity of good X is positive, then good X is said to be 29 . If it is negative, then good X is 30 .
The 31 elasticity of supply shows the responsiveness of quantity supplied to a change in the own price. This can be calculated by dividing the percentage change in the 32 by the percentage change in the 33 . The price elasticity of supply is never 34 because of the law of supply.
8. Budget Lines
Pat's weekly income is $120. She consumes pizza and root beer only. Pizza costs $5 per slice and root beer costs $3 per bottle. Assume pizza is on the y-axis.
a. Draw Pat's budget line.
b. Suppose Pat's weekly income is reduced to $90. Draw her new budget line.
c. Suppose Pat's income is still $120 per week, but root beer is now $4 per bottle. Draw Pat's new budget line.
d. Suppose Pat's income is still $120 per week, and root beer is $3 per bottle. However, pizza costs $3 per slice now. Draw Pat's new budget line.
9. Indifference Curves
Decide whether the following statements about indifference curves are FALSE or TRUE.
a. An indifference curve shows all combinations of two goods that yield the same level of satisfaction.
b. There exists an indifference curve passing through any point on the positive quadrant of the xy-plane, i.e. we have indifference maps.
c. As we move farther away from the origin, the utility level implied by the indifference curves is increasing.
d. Indifference curves can never cross.
10. Consumer Choice
John consumes food (F) and clothing (C). He has $200 per week to spend on these two goods. Price of food is $5 per meal and price of clothing is $20 per item.
a. Draw John's budget line. Put food on horizontal axis.
b. Suppose with these prices and his income, John chooses to consume 24 meals and 4 items of clothing per week. Mark this bundle on your graph. Also draw an indifference curve for John that shows this bundle as his utility maximizing bundle.
c. Suppose the marginal utility of food is 20 utils for John at the bundle described in part (b). What must be the marginal utility of clothing for John if he chooses this bundle as his utility maximizing bundle?
d. Can you say anything about John's total utility given this information?
11. Utility
Define the following concepts:
Marginal utility, total utility, the law of diminishing marginal utility, marginal rate of substitution, relative prices, utility maximization, income and substitution effects.
12. Income and Substitution Effects
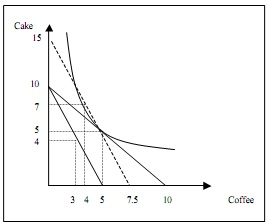
Mary consumes coffee (cups) and cakes (slices). The graph above shows Mary's budget and one of her indifference curves. Mary has $10 per week to spend on coffee and cakes. Cakes cost $1 per slice and coffee costs $1 per cup. Initially, Mary's utility maximization bundle is 5 slices of cake and 5 cups of coffee.
a. Write the equation of Mary's budget constraint. Note that this is identified by the line that has both a horizontal and a vertical intercept of 10 in the figure above. Interpret your findings.
b. Suppose the price of a cup of coffee doubles. Write the new equation of Mary's budget constraint. Note that this is identified by the line that has a vertical intercept of 10 and a horizontal intercept of 5. Interpret your findings.
c. With these new prices and her income, Mary decides to consume 3 cups of coffee and 4 slices of cake. What is the change in Mary's consumption of coffee? Identify numerically.
d. Suppose we want Mary to be able to afford her initial utility maximizing bundle (5 slices of cake and 5 cups of coffee) with the new prices. How much money does she need in order to make this possible?
e. If Mary had an income equal to the amount you found in part (d), she would choose to consume 4 cups of coffee and 7 slices of cake. Note that this is Mary's imaginary budget line and it has a vertical intercept of 15, and a horizontal intercept of 7.5. Verify the equation of this imaginary budget line using the income level that you found in part (d) and the new prices that Mary faces.
f. In part (c), you found the total change in Mary's consumption of coffee numerically. Now identify (numerically) how much of this total change is due to income effect, and how much of it is due to substitution effect.
13. Cost Functions
A wheat farmer has total production costs given by the equation TC = 100 + 6Q where Q is the output measured in bushels of wheat.
a. Identify total fixed costs (TFC) and total variable costs (TVC).
b. Find some examples of fixed costs and variable costs for the wheat farmer.
c. Write the equations of average total cost (ATC), average variable cost (AVC) and average fixed cost (AFC).
d. Draw the ATC, AVC, and AFC curves using the equations that you found in part (c).
e. What is the marginal cost (MC) for the farmer? Put this in your graph as well.
f. Interpret your graph.
14. Perfect Competition
a. Draw a graph representing the short-run equilibrium in a perfectly competitive industry where individual firms make positive economic profits.
b. What will happen to this industry in the long-run? Explain verbally and graphically.
c. Draw a graph representing the short-run equilibrium of a perfectly competitive industry in which individual firms make economic losses.
d. What will happen to this industry in the long-run? Explain verbally and graphically.
15. Monopoly and Price Discrimination
Suppose daily demand for airplane tickets between Chicago and Madison is given by the equation QD = 250 - P
a. If every plane has 200 seats and flying a plane between these two cities cost $5000 plus $50 per passenger, how many tickets would an airline monopoly sell? Assume that the monopolist has to charge the same price to everyone. What will the price per ticket be?
b. What are the profits of the airline? What is the consumer surplus? Find numerically and graphically.
c. If the airline were able to perfectly price discriminate, how many tickets would it sell? What is the range of prices that could be charged?
d. What is the average total cost for the optimal quantity in part (c)? Why is it optimal to sell some tickets below average total cost?
16. Monopoly and Natural Monopoly
The cost of providing electricity to the city of Madison is given by the equation
TC = 10 + 4Q while annual demand for electricity is given by QD = 8 - P/2.
a. Show that this is a natural monopoly. Provide some intuition for why you might expect a natural monopoly for the provision of electricity.
b. Suppose the city government auctions off a license to be the monopoly provider of electricity for one year. How much would you expect a firm to be willing to pay for the license? Give a numerical answer.
c. Suppose instead that the city government were to provide electricity itself and sell at the lowest price that can be charged without creating a loss. Compare producer profits and consumer surplus of this case to those in the case of a monopolist providing the services without acquiring the license, and to those in the case of a monopoly license being auctioned and the proceeds of the auction being given to the consumers (that is, you add the proceeds to the consumer surplus).
17. Oligopoly and Game Theory
There are two restaurants in a small town, both of which are owned and operated by local people: Al's Place and Betty's Place. There is no other major competitor. Al and Betty each are considering pricing burgers. Al's burger is quite similar to Betty's. They have two strategies: set a high price (H) or set a moderately high price (M). The payoff matrix that describes Al's and Betty's weekly profits under each situation is provided below (the first number in the pair represents Al's weekly profits while the second number in the pair represents Betty's weekly profits):
|
|
Betty M
|
H
|
|
Al M
|
1000,1000
|
1500,500
|
|
H
|
500,1500
|
1300,1300
|
a. Find the equilibrium outcome
b. Does any player have dominant strategies? If yes, what are they?
18. Monopolistic Competition
State whether the following statements about monopolistic competition are true or false.
a. There are many firms in a monopolistically competitive industry.
b. All firms in a monopolistically competitive industry produce identical products.
c. Under monopolistic competition, price exceeds marginal cost.
d. The output level chosen by a monopolistically competitive firm is inefficient.
e. Firms in a monopolistically competitive industry may make positive profits in the short-run.
f. Firms in a monopolistically competitive industry may make positive profits in the long-run.
19. Resource Markets
John owns a small coffee shop. He can sell a large cup of coffee for $2. The marginal product per hour of the workers that John employs is MPL = 5 = 0.5N where N is the number of workers.
a. If the market wage is $5 per hour, how many workers does John employ?
b. Assume there are a total of 10 coffee shops in town including John's, which are identical. In addition, there are a total of 50 workers who are all working, and the labor market is competitive. What is the market wage?
c. The government is concerned that the wage rate is too low, and decides to implement a minimum wage of $9 per hour. How many workers will lose their jobs?
20. Externalities
A steel factory has a demand curve given by Q = 1200 - 4P and a marginal private cost (MPC) given by MPC = Q + 200.
a. Draw the graph of demand and marginal private cost curves for the factory.
b. Find the equilibrium price and quantity.
c. This factory is located by a lake and the waste resulting from its production process is drained into the lake. The marginal social cost
(MSC) is given by MSC = Q + 250 . Add the MSC curve to the graph you have drawn for part (a). Find the socially efficient price and quantity combination.
21. Public Goods
Mary and Joe live in the same street. During the fall, they need to collect the leaves. Mary's demand for collecting leaves is given by P = 12 - Q and Joe's demand is given by P = 8 - 2Q (Q is the number of times the leaves are collected). The marginal cost of collecting the leaves in the street is $10.
a. Graph the demand curve for Mary and for Joe. Graph the aggregate demand curve. Include the marginal social cost curve in your graph and show the efficient level of production.
b. Solve for the optimum Q.
c. If neither Mary nor Joe free rides, and their demand curves show their willingness to pay, how much will Mary pay per unit? How much will Joe pay?