Reference no: EM13195576
1. What is the proportion of females at StatCrunchU, Determine a range of plausible values for this proportion. Is this proportion significantly larger than 0.5,
2. How are the students distnbuted across the classes of Freshman (1), Sophomore (2), Junior (3) and Senior (4), Does the proportion of females change across the classes,
3. What does the distnbvtion of credit hours look like, Does the mean number of credit hours per student appear to be significantly below 15 hours, Does the distribution of credit hours appear to be impacted by gender or class,
4. what is the proportion of students at StatCruncht/ that work, For those that do work, charactenze the distribution of the number of hours worked per week. For those students that work, also descnbe the relationship between the number of hours worked per week and the number of credit hours taken. Does this relationship appear to deer for full time students (enrolled in 12 or more credit hours) and part time students (enrolled in less than 12 credit hours),
5 What is the proportion of students at StatCruncht) that have loans, For those that do have loans. characterize the distribution of the loan amounts. Oo gender and/or class have an impact on the distnbution of loan amount, For students that work, is there a relationship between the amount of loans they have and the number of hours per week that they work,
6. What is the proportion of students at StatCrunchll that have credit card debt, For those students who have credit card debt, does the amount of credit card debt appear to be influenced by any one or any combination of the other variables,
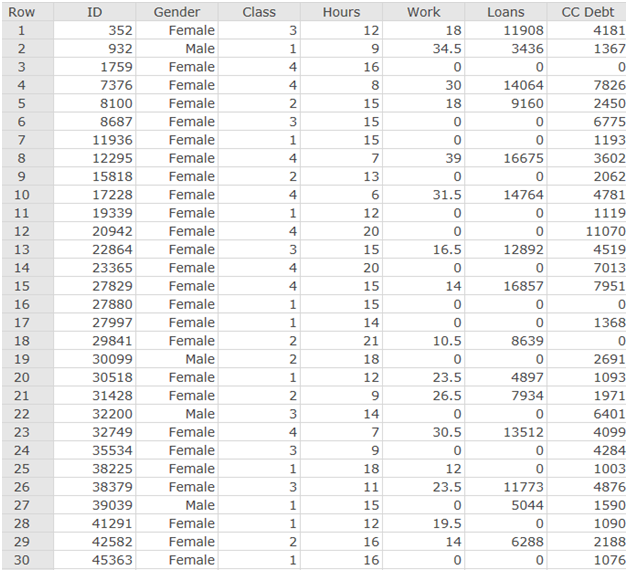
1. In Part A of this assignment, you selected a random sample of 30 StatCrunch U students and created a StatCrunch file containing data from the above survey for those students. You will use the StatCrunch data file you created in Part A to complete this assignment. Following the instructions at the end of Part A, paste your StatCrunch data file in the space below. This will allow your instructor to see your data.
PASTE YOUR SAMPLE DATA HERE:
2a. State a question related to a categorical variable that can be answered using your survey data and the techniques you have studied thus far in this course. You are encouraged to develop your own question, but you may use an appropriate question from the StatCrunch website. The question you use should be about the entire population of StatCrunch U students-not just about those in the sample. Assume that your sample is representative of the population.
b. Explain the methodology you will use to answer the question you posed. Your explanation should include answers to the following questions. Do not include your analysis or answers to your question here-only describe how you will do the analysis.
- What is the variable of interest?
- What graphical techniques will you use to describe your data?
- Why are those techniques appropriate? Why did you choose them?
c. Carry out the methodology described in b above. Use StatCrunch and paste copies of the graphs/charts from StatCrunch in the space below.
d. Based on the results of b and c above, answer your question. Include an explanation of how you used the graphs and charts to formulate your answer.
3a. State a question related to a numerical variable that can be answered using your survey data and the techniques you have studied thus far in this course. You are encouraged to develop your own question, but you may use an appropriate question from the StatCrunch website. The question you use should be about the entire population of StatCrunch U students-not just about those in the sample. Assume that your sample is representative of the population.
b. Explain the methodology you will use to answer the question you posed. Your explanation should include answers to the following questions. Do not include your analysis or answers to your question here-only describe how you will do the analysis.
- What is the variable of interest?
- What graphical techniques will you use to describe your data?
- Why are those techniques appropriate?
- Why did you choose them?
- What numerical measures will you use to describe your data?
- Why are those measures appropriate? Why did you choose them?
c. Carry out the methodology described in b above. Use StatCrunch and paste copies of the graphs/charts and numerical summaries from StatCrunch in the space below.
d. Based on the results of b and c above, answer your question. Include an explanation of how you used the graphs, charts, and numerical summaries to formulate your answer.