Reference no: EM138016
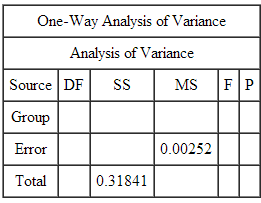
1. A manufacturer of infant formula is running an experiment using the standard (control) formula, and two new formulas, A and B. The goal is to boost the immune system in infants. 120 infants in the study are randomly assigned, to each of three groups: group A, group B, and a control group. The study is run for 12 weeks. At the end of the study the variable measured is total IGA (in mg per dl), with higher values being more desirable. We are going to run a one-way ANOVA on this data. A partial ANOVA table is given below.

The mean square for groups in this table is
A. 0.00786.
B. 0.01179.
C. 0.02357.
2. A researcher is studying treatments for agorophobia with panic disorder. The treatments are to be the drug Imipramine at the doses 1.5 mg per kg of body weight and 2.5 mg per kg of body weight. There will also be a control group given a placebo. Thirty patients were randomly divided into three groups of 10 each. One group was assigned to the control, and the other two groups were assigned to each of the two treatments. After 24 weeks of treatment, each of the subject's symptoms were evaluated through a battery of psychological tests, where high scores indicate a lessening of symptoms. Assume the data for the three groups are independent and the data are approximately Normal. The means and standard deviations of the test scores for the three groups are given below.
Multiple comparison procedures are going to be done using the Bonferroni method with α = 0.10. The value of t** is 2.2426. The smallest minimum significant difference (MSD) for finding a difference between groups is computed as 17.68. The correct conclusions from this procedure are:
A. The dose of 2.5 has a higher mean test score than either the control or the dose of 1.5. The control and the dose of 1.5 are indistinguishable.
B. Both treatments have a higher mean test score than the control. The two dose groups are indistinguishable.
C. The dose of 2.5 has a higher mean test score than the control. The two doses are indistinguishable, and the low dose and the control are indistinguishable.
|
What is the light intensity reaching the photocell
: Assume unpolarized light of intensity 197 W/m2 falls on the polarizer in the figure, and the angle in the drawing is 37.0°. What is the light intensity reaching the photocell?
|
|
Evaluate the t statistic for testing contrast
: The ANOVA table is given below,as well as a table of means and standard deviations for the three groups. Evaluate the t statistic for testing contrast
|
|
What is the sign of the charge on the wire
: How many 95W light bulbs can you use in a 120V circuit without tripping a 17A circuit breaker? (The bulbs are connected in parallel, which means that the potential difference across each light bulb is V.)
|
|
How to keep the pole motionless in a horizontal position
: You're carrying a 3.6-m-long, 25kg pole to a construction site when you decide to stop for a rest. You place one end of the pole on a fence post and hold the other end of the pole 35cm from its tip.
|
|
Correct conclusions from this procedure
: Multiple comparison procedures are going to be done using the Bonferroni method with α = 0.10. The value of t** is 2.2426. The smallest minimum significant difference (MSD) for finding a difference between groups is computed as 17.68. The correct ..
|
|
Calculate the acceleration of the counterweight
: A rifle fires a 2.39 10-2-kg pellet straight upward, since the pellet rests on a compressed spring that is released when the trigger is pulled. The spring has a negligible mass and is compressed by 9.17 10-2 m from its unstrained length. The pellet r..
|
|
The right of support is the plank''s center of gravity
: A father (m = 90 kg) and son (m = 45 kg) are standing facing each other on a frozen pond. The son pushes on the father and finds himself moving backward at 3 m/s after they have separated. How fast is the father moving.
|
|
Partial anova table
: Assume the data for the three groups are independent and the data are approximately Normal. The P-value is less than 0.01. The correct conclusion is that
|
|
What is the current flowing in the primary
: A step-up transformer has 300 turns on its primary coil and 90000 turns on its secondary coil if the current flowing through the secondary is 5 amps what is the current flowing in the primary.
|