Intermediate macroeconomics, Macroeconomics

Assignment Help:

An economy's IS and LM curves are given by the following equations:

1797_Intermediate Macroeconomics.png

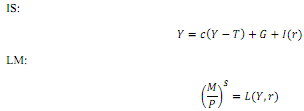
with Y indicating output (income), c indicating the marginal propensity to consume, I investment, G government spending, and r the real interest rate. M is money supply, P the price level, and L (Y,r) is the money demand function.

The government of this country institutes an investment tax credit (ITC). As a consequence, investors begin to make more investments at any given level of r.

(a) Suppose that the marginal propensity to consume  c is 0.8 and that the investment increase coming from the ITC is equal to $1,000. By how many $ will income exactly change in the Keynesian Cross?

(b) How will the ITC affect income, the interest rate, consumption and investment in the IS-LM model? Use the IS-LM model graph (plus other  graphs, if necessary) to support your answer.

Make sure that you label your graph properly and explain carefully in which direction and why particular curves shift.

(c) Is the impact of this policy on equilibrium income in the IS-LM model larger or smaller than the impact on income in the Keynesian Cross? Explain why.

(d) What should the central bank do in order to keep the interest rate at the initial level? Explain carefully and support your answer with a graph.


Related Discussions:- Intermediate macroeconomics

Money demand function, Assume that the money demand function is (M/P) d = 2...

Assume that the money demand function is (M/P) d = 2,200 - 200r, where r is the interest rate in percent. The money supply M is 2,000 and the price level P is2. If the price level

Types of market, #five differnces between a monopoly market and a monopolis...

#five differnces between a monopoly market and a monopolistic market

What is demand for money, Q. What is Demand for money? Demand for mone...

Q. What is Demand for money? Demand for money The demand for money depends negatively on R and positively on the Yin the IS-LM model As fo

Demand for green and chai tea, Given the data in the table below, provide a...

Given the data in the table below, provide an estimate of the arc price elasticity of demand for green and chai tea. Chai tea Price $/lb. 10.4, 10.5 Chai tea Quantity mil lbs. 75

Best estimate of real gdp, Consumption = $3 trillion, Investment spending =...

Consumption = $3 trillion, Investment spending =$2 trillion, Government purchases = $2 trillion, net exports via the ROW is $0 trillion. 1. What is the best estimate of real GDP

Decrease at the rate of subsequent withdrawals, How much do you have to dep...

How much do you have to deposit today in order to allow 5 annual withdrawals, beginning at the end of year 8, with the first withdrawal of $1000 with subsequent withdrawals decreas

Price, The prices of fresh fruits have risen recently in the Jackson area. ...

The prices of fresh fruits have risen recently in the Jackson area. Why would this have occurred? Explain.

Protectionisms, definition, argument to protectionism and argument against ...

definition, argument to protectionism and argument against protectionisms

Steady state in solow model, conditions for steady state in solow model.in ...

conditions for steady state in solow model.in what respects is golden rule different from steady state?

Equilibrium price and quantity of coffee, The quantity of coffee demanded, ...

The quantity of coffee demanded, QD, depends on the price of coffee, Pc, and the price of tea, PT. The quantity of coffee supplied, QS, depends on the price of coffee, Pc, and the

Write Your Message!

Captcha
Free Assignment Quote

Assured A++ Grade

Get guaranteed satisfaction & time on delivery in every assignment order you paid with us! We ensure premium quality solution document along with free turntin report!

All rights reserved! Copyrights ©2019-2020 ExpertsMind IT Educational Pvt Ltd