Reference no: EM131020435
Homework 3-
1. Consider the market for bicycles depicted in the graph below. Both the demand and the supply curves are linear in this market.
a. Using the information in the above graph, write an equation for the demand curve and an equation for the supply curve. Show how you found your answers.
b. Given the information in the above graph and your equations from (a), find the equilibrium price and quantity in this market. Show your work.
c. Given the information in the above graph, calculate the value of consumer surplus (CS) and producer surplus (PS). Show your work.
Suppose the government in this economy imposes a price ceiling of $200 in this market.
d. Given this price ceiling answer the following questions:
1. Determine how many bicycles will be sold in this market once this price ceiling is implemented.
2. Which side of the market is the "short side"?
3. Determine the value of consumer surplus with the price ceiling (CSpc) and the value of producer surplus with the price ceiling (PSpc). Show your work. Provide a well labeled graph to illustrate your answer.
4. Consider consumers and producers of bicycles: which group favors the implementation of this price ceiling? Explain your answer.
Now, suppose instead of the price ceiling, the government in this economy imposes a price floor of $400 in this market.
e. Given this price floor answer the following questions:
1. Determine how many bicycles will be sold in this market once this price floor is implemented.
2. Which side of the market is the "short side"?
3. Determine the value of consumer surplus with the price floor (CSpf) and the value of producer surplus with the price floor (PSpf). Show your work. Provide a well labeled graph to illustrate your answer.
4. Consider consumers and producers of bicycles: which group favors the implementation of this price floor? Explain your answer.
Now, suppose that the government implements neither a price ceiling nor a price floor in this market. Instead the government implements an excise tax of $100 per bicycle in this market and this excise tax is placed on producers of bicycles.
f. Given this excise tax, analyze its impact on the market for bicycles. Answer the following questions (show your work for all questions):
1. What is the quantity of bikes sold in this market after the implementation of the excise tax? What is the price in this market after implementation of the excise tax?
2. What is the tax revenue the government will earn with this excise tax?
3. What is the value of consumer surplus with the excise tax (CSet)?
4. What is the value of producer surplus with the excise tax (PSet)?
5. What is the economic incidence of the tax on consumers (Consumer Tax Incidence = CTI)?
6. What is the economic incidence of the excise tax on producers (Producer Tax Incidence = PTI)?
7. Provide a well labeled graph to illustrate your answers.
2. Return to the set-up you had in (1). Now, let's compare three different excise taxes. An excise tax levied on producers of $100 per bike, an excise tax levied on producers of $200 per bike, and an excise tax levied on producers of $300 per bike. Analyze these three different excise taxes and then organize your results in the following table where CTI is the consumer tax incidence, PTI is the producer tax incidence, CS is consumer surplus, PS is producer surplus, and deadweight loss is DWL. Show your work in space below your completed table.
|
Excise Tax
|
Qe with Excise Tax
|
P paid by consumers
|
CTI
|
PTI
|
Tax Revenue
|
CS
|
PS
|
DWL
|
|
$100 per bike
|
|
|
|
|
|
|
|
|
|
$200 per bike
|
|
|
|
|
|
|
|
|
|
$300 per bike
|
|
|
|
|
|
|
|
|
3. Consider the market for apples in a small, closed economy. This market can be described by the following demand and supply equations where P is the price per applemeasured in cents and Q is the number of apples:
Domestic Demand Curve: Q = 100 - P
Domestic Supply Curve: Q = P - 20
a. Given the above information, calculate the equilibrium price (Pe) and equilibrium quantity (Qe) in this market. Show your work.
b. Given the above information, draw a graph representing the domestic market for apples. In your graph, measure price on the vertical axis and quantity on the horizontal axis. Label the graph completely and carefully. Then, calculate the value of consumer surplus (CS) and producer surplus (PS). Label the areas of CS and PS in your graph. Calculate the value of total surplus (TS).
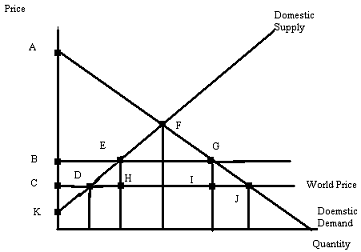
Suppose that the world price of apples is 40 cents per apple. This small, closed economy decides to open its apple market to trade.
c. Given that this market is now open to trade, what will be the price of apples in this small economy? How many apples will domestic producers produce? How many apples will domestic consumers consume? How many apples will be imported or exported? Explain your answers and provide a well labeled graph illustrating these answers.
d. Given that this market is now open to trade, what will be the value of CS' in the domestic market now? What will be the value of PS' in the domestic market now? Shade these new areas on the graph you drew in (c) and label them clearly. What is the value of TS' for this domestic economy when the apple market is open to trade? In this domestic economy who favors opening this market to trade and why do they hold this view? In this domestic economy who is against opening this market to trade and why do they hold this view?
e. Suppose this domestic economy opens its apple market to trade, but at the same time it implements a tariff that raises the price of an apple to 50 cents. Given this tariff, what is the value of CS", the value of PS", the tariff revenue the government earns, the value of the DWL from the implementation of the tariff, and the level of imports once the tariff is imposed on this market? Show how you found your answers. Then, provide a well labeled graph showing these areas and illustrating your analysis.
4. Consider the market for apples in a small, closed economy. This market can be described by the following demand and supply equations where P is the price per apple measured in cents and Q is the number of apples:
Domestic Demand Curve: Q = 100 - P
Domestic Supply Curve: Q = P - 20
Suppose that the world price of apples is 40 cents per apple. This small, closed economy decides to open its apple market to trade. (Note: that this is the same apple market you just analyzed in the last question.)
a. Suppose this domestic economy opens its apple market to trade, but at the same time it implements animport quota of 20 apples. Draw a graph of this market that illustrates this import quota by representing the import quota as a new supply curve that includes this import quota. Label the graph carefully and completely and make sure that all points of intersection have their coordinates identified.
b. Write an equation for the new supply curve that includes the initial supply plus the import quota.
c. Use the new supply curve and the initial demand curve to solve for the new equilibrium quantity and equilibrium price with this import quota. Show your work. How many apples will be consumed? How many apples will be produced domestically? How many apples will be imported?
d. Calculate the value of consumer surplus with the import quota (CS*), producer surplus with the import quota (PS*), license holder revenue, and the deadweight loss (DWL*) from the implementation of this import quota. Show your work. Then, provide a well labeled graph that illustrates these areas.
e. Given the import quota described in this problem, what is the maximum amount an importer would pay for the license rights to import apples given this import quota? Explain your answer.
5. Let's do some work with the externality issue. For each for the following situations analyze what the market outcome is and what the socially optimal amount of the good should be. I will do a sample one for you first.
Sample: A community is situated on the banks of a pristine river. Upstream there is a beer producer who uses this beautiful water to brew its beer and then discharges the industrial waste from its production back into the river. This has resulted in fish kills, strong and unpleasant smells, and the closing of the community's beach. Depict the beer market's current market outcome as well as what the socially optimal outcome would look like. Explain your analysis. In your analysis make sure you identify any deadweight loss (DWL) that is occurring. The simplest solution will be either a tax on the good or a subsidy on the good: please advise as to which policy is needed!
a. Suppose Amanda's Mechanics has pioneered a new robotic technology that has been immensely important for her business, but is also potentially providing large spillover effects to other non-related businesses that will be able to use the robotic technology in different settings than the one initially imagined by Amanda's Mechanics. Given these spillover effects analyze what's happening in the market for good X when the market does not take into account these spillover effects. Then analyze what would happen if the market internalized these spillover effects. Label your graph clearly and completely.
b. Researchers have discovered that regular aerobic exercise provides substantial benefits to the individuals who engage in this activity. These benefits also impact the whole community because healthcare costs fall dramatically when individuals engage in regular aerobic exercise. Given this information analyze what's happening in the market for exercise when the market does not take into account these social benefits. Then analyze what would happen if the market internalized these social benefits gleaned from consumption of aerobic exercise. Label your graph clearly and completely.
c. Each year Josie's neighbors put up a tasteful selection of holiday lights. These holiday lights bring welcome cheer to all the neighbors who live nearby. Josie's neighbors only consider the private benefits they get from enjoying the consumption of these lights. Analyze the market for holiday lights when the market does not take into account the social benefits that others receive from enjoying the lights. Then analyze what would happen if the market internalized these social benefits. Label your graph clearly and completely.
6. For this question go to the blog "Life's Curiosities: An Economist's Perspective". You can find this blog at https://www.billkellyassociates.com/. Once you are at the site, look around a bit and then proceed to this question.
Looking on the "Contents" page scroll down until you find "6. What's a Student to Do?" and "7. Amazing Career Database".
a. Read the whole entry "What's a Student to Do?" and then read the entry "Check Out an Occupation". Study these articles carefully. What would you say are the two most important things to know from these articles? Write a short paragraph that highlights at least two points that you found interesting in these two entries. How did these readings impact you? Did you learn something or did you find your thinking about your education altered because of these readings? Be thoughtful here. If you would like, shoot Bill Kelly a short (or long) email about the experience: his email is [email protected]. (We want you to be part of our "focus group".)
b. Now go to the websites discussed in the article "CheckOut an Occupation". Use the websites that are referred to in this article to research a potential career you think you are interested in. Find out information about this career from this data set. What is the salary for the top 10% of earners in this career? What is the salary for the bottom 10% of earners in this career? What particular skills and attributes are necessary to work in this profession?
c. Repeat this process for another career that you think you might be interested in pursuing. I want you to look into careers that you find attractive or compelling since we are talking about YOUR LIFE.
d. For each of the careers you explored in (b) and (c) write separate paragraphs where you evaluate your current strengths, interests and attributes with regard to the specific career you researched. Do you think you are a potentially good fit for the career you researched? If yes, explain why. If no, explain why. There should be two paragraphs minimum here since you are researching two different careers.
e. Write a final paragraph about how this experience impacted you. Did you learn anything from the experience? Were you introduced to datasets that were new to you? Did you find the undertaking an insightful experience? Expand on your answers here.
7. For this question go to the blog "Life's Curiosities: An Economist's Perspective". You can find this blog at https://www.billkellyassociates.com/. Once you are at the site, look around a bit and then proceed to this question. I am interested in your feedback about these materials because our goal is to provide informative analysis to our readers: so here is your chance to experience being part of a "focus group".
a. Select any one of the articles listed in the contents section posted on this website (except the two mentioned in problem (6)) and read the article. Then do a critique of the article. Was it interesting? Was it thought provoking? What was good about the article? What was missing? What questions were raised in your mind after reading the article? What would you advise to improve the experience you had? Just a paragraph or two paragraphs here.
b. For the article you read: did you learn anything? Did you find the article made you think about something in a new or different way? Explain what you learned and how this experience impacted you. Just a paragraph or at most two paragraphs here.
c. If so motivated, send Bill Kelly your thoughts (this is not required for the homework-just trying to encourage you to feel free to comment!). His email is [email protected]. We have tough hides and will not take your feedback personally: you may help us grow and learn-and we think that is really fun and exciting (and encourage you to like growing and learning).
8. Suppose that the market for widgets is described by the following two equations where P is the price per widget and Q is the quantity of widgets:
Demand: P = 20 - 2Q
Supply: P = 4 + 6Q
Furthermore, you are told that the production of widgets involves a negative externality of $4 per widget that the market is currently not taking into account.
a. Given this information, what is the equilibrium price and output in the market for widgets? Show your work.
b. Given this information, what is the value of consumer surplus (CS), producer surplus (PS), and the total cost of the externality that arises from producing the widgets. Provide a graph that illustrates CS and PS. Then, provide a second graph that illustrates CS, PS, and the externality cost. Label these graphs carefully and clearly.
c. The total surplus (TS) in this market will be equal to: TS = CS + PS - total externality cost. Calculate the value of TS.
d. Suppose that the government imposes an excise tax on producers so that the externality cost associated with producing widgets is completely internalized in the market. How big would this excise tax need to be? Explain your answer. Given this perfect excise tax to take care of this externality what would be the equation for the new supply curve that contains this excise tax?
e. What will be the socially optimum amount of widgets to produce? Find the new price and the new quantity associated with this social optimum. Then, calculate CS' and PS'. (Hint: you will find it helpful to draw a graph to illustrate CS' and PS'!) Then calculate the excise tax revenue, and the externality cost. Then, calculate TS' which can be found using the following equation: TS' = CS' + PS' + (excise tax revenue) - externality cost. Show your work for all of these calculations.
f. Compare TS from (c) with TS' from (e). What happened to TS after correcting for the externality? Provide a graph that illustrates the deadweight loss due to this externality if the externality is not corrected for in the market.
9. Revisit Chapter 12 of Charles Wheelan'sNaked Economics. Write a brief memo summarizing the key concept(s) from this chapter for your imaginary boss. Imagine that your boss is a busy person who does not have a lot of free time but wants to be well informed. What points do you want to communicate to this boss and how will you express these points? [Do not simply provide a list of the statements in bold in the chapter for this memo.] Since you are writing this for your boss that may influence what you want to stress in your presentation.
10. At this point you have read at least six chapters in the Charles WheelanNaked Economics. [Chapters 1 through 5 and Chapter 12] Write a book report no longer than five paragraphs expressing an overview of the book from your perspective, noting both its strengths and weaknesses as well as how this book has impacted your thinking. At the end give a recommendation about whether you would recommend this book to someone interested in learning more about economics.