Reference no: EM131262816
1. A researcher reports that, on average, the participants in his study lost 10.4 lbs. after two months on his new diet. A friend of yours comments that he tried the diet for two months and lost no weight, so clearly the diet was a fraud. Which of the following statements is necessarily correct?
(a) Your friend must not have followed the diet correctly since he did not lose weight.
(b) Since your friend did not lose weight, the researcher's report must not be correct.
(c) In order for the study to be correct, we must now add your friend's results to those of the study and recompute the new average.
(d) The data must be skewed left since your friend's weight loss was less than the mean.
(e) The report only gives an average. This does not imply that all participants in the study lost 10.4 lbs. or even that all lost weight. Your friend's experience does not necessarily contradict the study's results.
2. A local radio station has a fan base of 20,000 listeners. The station wants to know if its audience would prefer more music or more talk shows. Asking all 20,000 listeners is an almost impossible task.
The station uses convenience sampling and surveys the first 200 people they meet at one of the station's music concert events. 24 people said they'd prefer more talk shows, and 176 people said they'd prefer more music.
Do you think that this sample is representative of (or is characteristic of) the entire 20,000 listener population? Explain.
3. Airline companies are interested in the consistency of the number of babies on each flight, so that they have adequate safety equipment. Suppose an airline conducts a survey. Over Thanksgiving weekend, it surveys six flights from Boston to Salt Lake City to determine the number of babies on the flights. It determines the amount of safety equipment needed by the result of that study.
(a) Using complete sentences, list three things wrong with the way the survey was conducted.
(b) Using complete sentences, list three ways that you would improve the survey if it were to be repeated.
4. Suppose you want to determine the mean number of students per statistics class in your state. Describe a possible sampling method in three to five complete sentences. Make the description detailed.
5. The following box plot shows the U.S. population for 1990, the latest available year.
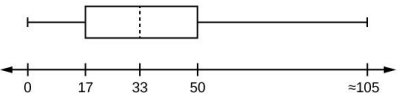
Are there fewer or more children (age 17 and under) than senior citizens (age 65 and over)? How do you know? Explain.
6. Twenty-five randomly selected students were asked the number of movies they watched the previous week. The results are shown in the table.
|
# of movies
|
Frequency
|
|
0
|
5
|
|
1
|
9
|
|
2
|
6
|
|
3
|
4
|
|
4
|
1
|
(a) Find the 5-Number Summary and construct a box plot of the data.
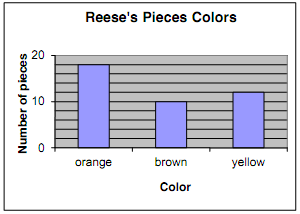
7. The graph displays the number of pieces of each color in a sample of Reese's Pieces.
(a) Use the graph to fill in the values for the table below. When necessary, round to the nearest whole percent.
|
Color
|
Frequency
|
Relative Frequency
|
|
Orange
|
|
|
|
Brown
|
|
|
|
Yellow
|
|
|
(b). If possible, find the mean color. If it is not possible, explain why.
8. A researcher wants to find the percentage of likely voters in a given state who will vote "yes" on an upcoming statewide ballot referendum. The population of the state is 3 million, and there are about 1.8 million likely voters. The researcher plans to survey 1100 likely voters chosen at random from the population of interest.
(a) What population is the researcher trying to investigate?
(b) What is the sample size the researcher is planning to use?
9. The test scores on a certain statistics test have a bell-shaped distribution with a mean of 75.3 and a standard deviation of 7.9. Use the empirical rule to answer the following.
(a) The middle 68% of the students who took that test should have scored between what two scores?
(b) The bottom 2.5% of the students who took the test should have scored below what score?
(c) What percent of the students who took the test scored between 75.3 and 91.1?
10. Students at a university who apply for campus housing can be assigned to live in a dormitory room, a suite in a dormitory or an apartment. If Alice has a 0.30 chance of being assigned to a dormitory room and a 0.50 chance of being assigned to a suite in a dormitory, what is the probability that she will be assigned to an apartment?
11. When two dice are rolled, there are 36 possible outcomes. Six of these outcomes have two of the same numbers (two ones, two twos, etc.). The chance of getting two of the same numbers when rolling two dice is 6/36 or 0.1667. What is the chance of getting 2 numbers that are different from one another?
12. The lifetime risk for a woman to develop breast cancer is estimated to be about 1 in 8. Express this probability as a fraction, as a proportion (decimal), and as a percentage.
Questions 13 and 14: A statistics class has 4 teaching assistants (TAs): three female assistants (Lauren, Rona, and Leila) and one male assistant (Josh). Each TA teaches one discussion section.
13. A student picks a discussion section. The two events W = {the TA is a woman} and J = {the TA is Josh} are
(a) independent events.
(b) disjoint (mutually exclusive) events.
(c) both independent and mutually exclusive
(d) None of the above
14. Two students, Bill and Tom, who don't know each other, each pick a discussion section. The two events B = {Bill's TA is Lauren} and T = {Tom's TA is a woman} are
(a) independent events.
(b) disjoint (mutually exclusive) events.
(c) both independent and mutually exclusive
(d) None of the above.
15. A birth is selected at random. Define events B = {the baby is a boy} and F = {the mother had the flu during her pregnancy}. The events B and F are
(a) disjoint but not independent.
(b) independent but not disjoint.
(c) both independent and disjoint.
(d) neither disjoint nor independent.
Questions 16 and 17: A student is randomly selected from a large college campus. Define the events H = {the student has blond hair} and E = {the student has blue eyes}.
16. The events H and E are
(a) disjoint but not independent.
(b) independent but not disjoint.
(c) disjoint and independent.
(d) neither disjoint nor independent.
17. The chance that a blond haired student also has blue eyes is 75%. How do we write this probability?
Questions 18 to 20: A student is randomly selected from a large college. Define the events C = {the student owns a cell phone} and I = {the student owns an iPod}.
18. Which of the following is the correct interpretation of the probability P(I|C)?
(a) The chance that a randomly selected student owns an iPod.
(b) The percentage of students who own both a cell phone and an iPod.
(c) The proportion of students who own a cell phone who also own an iPod.
(d) The relative frequency of iPod owners who own a cell phone.
19. Which of the following is the correct notation for the percentage of students who own a cell phone but not an iPod?
(a) P(C|I)
(b) P(C|IC)
(c) P(CC and I)
(d) P(C and IC)
20. Suppose you know that your friend's sister, who attends this college, owns a cell phone and you are wondering what would be the chance that she owns an iPod. What type of probability would this be?
(a) A probability of independent events.
(b) A probability of dependent events.
(c) A conditional probability.
(d) A probability of disjoint events.
21. Michael wants to take French or Spanish, or both. But classes are closed, and he must apply and get accepted to be allowed to enroll in a language class. He has a 50% chance of being admitted to French, a 50% chance of being admitted to Spanish, and a 20% chance of being admitted to both French and Spanish. If he applies to both French and Spanish, the probability that he will be enrolled in either French or Spanish (or possibly both) is
Questions 22 to 23: A standard 52-card deck is shuffled and 2 cards are picked from the top of the deck.
22. The probability that the first card is a Heart and the second card is a Spade is
23. The probability that the both cards are Hearts is
24. Two standard 52-card decks are shuffled and two cards are picked at random - one card from each deck. The probability that two Hearts are drawn is
25. Why are the answers to problems 23 and 24 different? Explain.
Questions 26 and 27: A card is drawn at random from a standard 52-card deck.
26. The conditional probability that the card is a King given that a face card (Jack, Queen, or King) was drawn is
27. The conditional probability that the card is a 2 given that a 2 or a 3 was drawn is
28. Which of the following is definitely true for mutually exclusive events A and B?
(a) P(A) = 1 - P(B)
(b) P(A) + P(B) = 1
(c) P(A and B) = P(A)P(B)
(d) P(A and B) = 0
29. Suppose that the probability of event A is 0.2 and the probability of event B is 0.4. Also, suppose that the two events are independent. Then P(A|B) is:
(a) P(A) = 0.2
(b) P(A) / P(B) = 0.2/0.4 = ½
(c) P(A)P(B) = (0.2)(0.4) = 0.08
(d) None of the above.
Questions 30 to 32: A mail-order company classifies its customers by gender (male/female) and by location of residence (urban/suburban). The market research department has determined that 2/3 of their customers are female and that 75% of their customers live in the suburbs. They have also determined that gender and location of residence seem to be independent of one another.
30. If the mail order company will randomly select one of their customers, what is the probability that it will be a suburban female?
31. The mail order company will randomly select one of their customers. Suppose we know they have selected a person in the suburbs. What is the probability that this person is female?
32. Making up the majority of their customers, the females and suburban customers are identified as the focus group for their new ad campaign. If the mail order company will randomly select one of their customers, what is the probability that it will be a suburban customer or a female?
33. A short quiz has two true-false questions and one multiple-choice question with four choices. A student guesses at each question. Assuming the choices are all equally likely, what is the probability that the student gets all three correct?
Questions 34 to 37: A study was conducted at a small college on first-year students living on campus. A number of variables were measured. The table below provides information regarding number of roommates and end of term health status for the first-year students at this college. Health status for individuals is measured as poor, average, and exceptional.
|
Health status
|
Number of roommates
|
|
None
|
One
|
Two
|
|
poor
|
15
|
36
|
65
|
|
average
|
35
|
94
|
40
|
|
exceptional
|
50
|
50
|
25
|
34. What is the probability that a randomly selected first-year student with no roommates had poor end of term health status? (Hint: Re-read this question. Is this a conditional probability, or not?)
35. What is the probability that a randomly selected first-year student with 1 roommate had poor end of term health status?
36. Are the events H = {the student has poor health status} and N = {the student has no roommates} mutually exclusive?
37. Are the events H = {the student has poor health status} and N = {the student has no roommates} independent?
Questions 38 to 40: Thirty percent of the students in a high school face a disciplinary action of some kind before they graduate. Of those students, 40% go on to college. Of the 70% who do not face a disciplinary action, 60% go on to college.
38. What percent of the students from the high school go on to college?
39. What is the probability that a randomly selected student both faced a disciplinary action and went on to college?
40. Given that a randomly selected student goes on to college, what is the probability that he or she faced a disciplinary action?
Questions 41 to 44: In a survey of 1000 adults, respondents were asked about the expense of a college education and the relative necessity of financial assistance. The correspondents were classified as to whether they currently had a child in college or not (college status), and whether they thought the loan obligation for most college students was too high, about right, or too little (loan obligation opinion). The table below summarizes some of the survey results. Use these results to answer the following questions.
|
|
Loan Obligation Opinion
|
|
College Status
|
Too High
|
About Right
|
Too Little
|
Total
|
|
Child in College
|
350
|
80
|
10
|
440
|
|
No Child in College
|
250
|
200
|
110
|
560
|
41. What is the probability that a randomly selected adult will think loan obligations are too high?
42. What is the probability that a randomly selected adult with a child in college will think loan obligations are too high?
43. Are the events H = {the adult thinks loan obligations are too high} and C = {the adult has a child in college} mutually exclusive? Explain.
44. Are the events H = {the adult thinks loan obligations are too high} and C = {the adult has a child in college} independent? Explain.
45. If events A and B are mutually exclusive (disjoint) then
(a) they must also be independent.
(b) they cannot also be independent.
(c) they must also be complements.
(d) they cannot also be complements.
46. Which of the following statements is true for 6 tosses of a fair coin, where H = Heads and T = Tails?
(a) Sequences with all heads, like HHHHHH, are less likely than specific sequences with 3 heads and 3 tails, like HTHTHT.
(b) Sequences with all heads, like HHHHHH, are more likely than specific sequences with 3 heads and 3 tails, like HTHTHT.
(c) All specific sequences six letters long (made up of H's and T's), regardless of the number of H's and T's, are equally likely.
(d) None of the above.
Questions 47 to 49: Based on her past experience, a professor knows that the probability distribution for X = number of students who come to her office hours on a Wednesday is given below.
|
k
|
0
|
1
|
2
|
3
|
4
|
|
P(X = k)
|
0.10
|
0.20
|
0.50
|
0.15
|
0.05
|
47. What is the probability that at least 2 students come to office hours on a Wednesday?
48. What is P(X ≤ 2)?
49. What is the probability that at least 1 student comes to office hours on a Wednesday?
Questions 50 to 51: Joan has noticed that the probability distribution for X = number of students in line to use the campus ATM machine when she shows up to use it is shown below.
|
k
|
0
|
1
|
2
|
3
|
4
|
|
P(X = k)
|
0.10
|
0.10
|
0.40
|
0.30
|
0.10
|
50. What is the probability that there will be no more than 1 student in line when Joan shows up?
51. What is the mean of this probability distribution? Interpret this value, in context, in a sentence.
Questions 52 to 54: The Southside Bowling Alley has collected data on the number of children that come to birthday parties held at the bowling alley. Let the random variable X = the number of children per party. The distribution for the random variable X is given below.
|
Value of X
|
5
|
6
|
7
|
8
|
9
|
10
|
|
Probability
|
0.15
|
0.2
|
0.1
|
0.25
|
0.1
|
0.2
|
52. What is the probability that at least 7 children will come to a party?
53. Suppose one party is to be randomly selected. We know that there will be at least 7 children at this party. What is the probability that there will be 10 children at the party?
54. Suppose one party is to be randomly selected. What is the expected number of children that will attend this party? Include the appropriate symbol and units in your answer.
55. Which one of these variables is a binomial random variable?
(a) Time it takes a randomly selected student to complete a multiple choice exam.
(b) Number of textbooks a randomly selected student bought this term.
(c) Number of women taller than 68 inches in a random sample of 5 women.
(d) Number of CDs a randomly selected person owns.
56. Consider an experiment that involves repeatedly rolling a six-sided die. Which of the following is a binomial random variable?
(a) The number of rolls until a "4" is rolled for the first time.
(b) The number of times that a "4" is rolled when the die is rolled six times.
(c) The sum of the numbers observed on the first six rolls.
(d) It is not possible to have a binomial random variable when rolling a six-sided die because a binomial random variable allows only two possible outcomes, not six.
57. Which of the following is an example of a binomial random variable?
(a) The number of games your favorite baseball team will win this coming season.
(b) The number of questions you would get correct on a multiple-choice test if you randomly guessed on all questions.
(c) The number of siblings a randomly selected student has.
(d) The number of coins a randomly selected student is carrying.
Questions 58 to 61: In a family with 4 children, the number of children with blue eyes is a binomial random variable X with n = 4 and p = .20.
58. What is the probability that all 4 children will have blue eyes?
59. What is the probability that exactly 3 children will have blue eyes?
60. What is the probability that none of the children will have blue eyes?
61. What is the expected number of children with blue eyes?
62. Suppose that a quiz consists of 20 True-False questions. A student hasn't studied for the exam and will just randomly guesses at all answers (with True and False equally likely). Find the probability that the student will get 8 or fewer answers correct.
63. At a school field day, 50 students and 50 faculty members each completed an obstacle course. Descriptive statistics for the completion times (in minutes) for the two groups are shown below.
|
|
Students
|
Faculty Members
|
|
Mean
|
9.90
|
12.09
|
|
Median
|
9.25
|
11.00
|
|
Minimum
|
3.75
|
4.50
|
|
Maximum
|
16.50
|
25.00
|
|
Lower quartile
|
6.75
|
8.75
|
|
Upper quartile
|
13.75
|
15.75
|
(a) What span of times represents the middle 50% for students?
(b) What span of times represents the fastest 25% for faculty?
(c) Determine whether the fastest and/or slowest student times are outliers, and then do the same for the faculty times. Show your work, and be sure to follow the IQR-based method explained in class.
(d) Use the grid below to draw box-plots for the completion times for students and for faculty members.
(e) Give the name of a statistic that you would use to measure the spread (variability) of each group's times (students, faculty). Then give the value of this statistic for each group.
(f) According to your answer to the previous question, which group had more variability in their obstacle course times, students or faculty? Or does your answer to (e) show equal variability?
64. Here are the counts of the student body at a college, broken down by age and gender. Suppose a student is chosen at random from this population.
|
Age
|
14-17
|
18-24
|
25-34
|
35 or older
|
Totals
|
|
Male
|
80
|
1450
|
600
|
200
|
2330
|
|
Female
|
20
|
1550
|
650
|
450
|
2670
|
|
Totals
|
100
|
3000
|
1250
|
650
|
5000
|
(a) What is the probability that the student is female?
(b) What is the conditional probability that the student is female given that the student is 35 or older?
(c) What is the probability that the student is female and is 35 or older?
(d) What is the probability that the student is female or is 35 or older?
65. In a poll of registered voters in a particular town, 51% of voters supported a new tax to fund the public schools. For voters with one or more children in the town's public schools, the approval rating was higher, 56%. The approval rating for those without children was 45%. Suppose one person is selected at random from those responding to the poll. Let S stand for the event "supports the new tax" and C stand for "has 1 or more children in the town's public schools". Answer the following.
(a) P(S) = P(S | C) =
(b) According to your answers above, are the events S and C independent or dependent? Why?
66. A small high school has sixty students in the senior class. There are twenty total seniors who compete in the school rodeo, some of whom are also in the band. There are fifteen total seniors who play in the school band, some of whom also participate in the rodeo. In fact, there are exactly five students who are in both the band and the rodeo.
(a) Fill in the values for the frequency table.
One student is to be selected at random from the sixty seniors. Let R represent the event that this student competes in the rodeo. Let B represent the event that the student plays in the school band.
(b) P(R) =
(c) P(B) =
(d) P(R and B) =
(e) P(R or B) =
(f) P(R | B) =
(g) Are event R and event B disjoint for this senior class (yes/no)?
(h) Using one or more of your answers to parts (b) through (f), show the mathematical justification for your answer to part (g).
67. Carl has a trick die. It is impossible to roll a 2, and the probability is 0.6 that the die shows 3 when rolled. The other numbers (1, 4, 5, and 6) each have a probability of 0.1 of occurring when the die is rolled. The table below shows what this means.
|
Roll
|
1
|
2
|
3
|
4
|
5
|
6
|
|
Probability
|
0.1
|
0
|
0.6
|
0.1
|
0.1
|
0.1
|
Carl rolls the die once. Consider the events D = {roll is even}, E = {roll is 1, 2, or 3}, and F = {roll is 2}. Find the following probabilities.
(a) P(D) = P(E) = P(F) =
(b) P(DC) = P(EC) = P(FC) =
68. The Empirical Rule states that for bell-shaped distributions, about 68% of the values fall within 1 standard deviation of the mean. The heights of women at a large university are approximately bell-shaped, with a mean of 64.5 inches and standard deviation of 2.5 inches. Use this information to answer the questions.
(a) What is the probability that the height of a randomly selected woman from this university is between 62 and 67 inches?
(b) What is the probability that the height of a randomly selected woman from this university is 67 inches or taller?
(c) What is the probability that the height of a randomly selected woman from this university is 67 inches or shorter?
(d) What is the probability that three randomly selected women from this university are all 67 inches or taller?
(e) What is the probability that of two randomly selected women, one is 67 inches or shorter and the other is 67 inches or taller?
69. A certain genetic abnormality is present in 3% of all mice. When the abnormality is present in a mouse, a test correctly identifies its presence in 95% of the time. When the abnormality is not present, the test correctly shows this 90% of the time.
Suppose a mouse is chosen at random.
G = the event that a randomly selected mouse actually has the genetic abnormality.
T = the event that the test shows the presence of the abnormality.
Complete the following table for a hypothetical population of 10,000 mice.
|
|
Test shows abnormality is present
|
Test shows abnormality is not present
|
Total
|
|
Actually has abnormality
|
|
|
|
|
Does not have abnormality
|
|
|
|
|
Total
|
|
|
10,000
|
(a) P(G) =
(b) P(T|G) =
(c) P(T) =
(d) P(G|T) =
(e) Write a sentence or two explaining, in non-technical language, what your answer to part (d) means in the context of the problem.
70. A researcher carefully computes the correlation coefficient between two variables and gets r = 1.23. What does this value mean?
71. It has been noted that there is a positive correlation between the U.S. economy and the height of women's hemlines (distance from the floor of the bottom of a skirt or dress) with shorter skirts corresponding to economic growth and lower hemlines to periods of economic recession. Comment on the conclusion that economic factors cause hemlines to rise and fall.
72. Given a set of paired data (X, Y)
(a) If Y is independent of X, then what value of a correlation coefficient would you expect?
(b) If Y is linearly dependent on X, then what value of a correlation coefficient would you expect?
73. A researcher has a large number of data pairs (age, height) of humans from birth to 70 years. He computes a correlation coefficient.
(a) Would you expect it to be positive or negative? Why?
(b) How does the correlation coefficient relate to the slope of the regression line?
74. A student wants to compute the correlation coefficient with two data pairs. What value or values of r should he expect? Why?