Reference no: EM131134338
BIOSTAT ASSIGNMENT 1: PROBABILITIES AND POWER ANALYSIS
PART ONE: PROBABILITIES
Suppose that 25 persons who ate a buffet lunch at a particular restaurant developed salmonella infections (i.e. food poisoning). We are interested in finding out what food from the buffet was associated with becoming ill. To investigate this, we ask the 25 individuals who became ill (the cases), and another 100 persons who ate at the buffet but did not become ill (the controls), what they ate. Imagine that we observe the following results for the items offered that are most likely to be the source of the infection:
Table 1.1: Frequencies of eating different foods for cases and for controls *
|
FOOD
|
CASES
|
CONTROLS
|
|
Potato salad
|
8
|
32
|
|
Chicken salad
|
12
|
24
|
|
Egg salad
|
3
|
10
|
|
Seafood salad
|
5
|
20
|
|
Cole slaw
|
4
|
16
|
|
Deviled eggs
|
11
|
40
|
|
Turkey
|
12
|
18
|
|
Dressing
|
10
|
25
|
|
Chicken
|
7
|
30
|
*Eating a particular food is considered an event.
1) Consider the information provided in Table 1.1 and answer the following questions:
a. Are these events mutually exclusive? Why or why not?
b. What is the probability of eating potato salad given that a person was a case? Show your work. [Hint: This is a conditional probability]
c. Calculate the probabilities of eating each of the foods for cases and for controls and put the results of your calculations in Table 1.2 (below) Report proportions, not percentages, and show 2 decimal places. [Note: Your answer to 1b is the first cell in the table (i.e. probability of eating potato salad for a case).]
Table 1.2: Probabilities of eating different foods for cases and for controls
|
FOOD
|
CASES
|
CONTROLS
|
|
Potato salad
|
|
|
|
Chicken salad
|
|
|
|
Egg salad
|
|
|
|
Seafood salad
|
|
|
|
Cole slaw
|
|
|
|
Deviled eggs
|
|
|
|
Turkey
|
|
|
|
Dressing
|
|
|
|
Chicken
|
|
|
2) Calculate the following probabilities; refer to your result in Table 1.2 and show your work. [Report proportions out to two decimal places.]
a. What is the probability that a case ate either turkey or chicken if no one ate both?
b. What is the probability that a control ate either turkey or chicken if no one ate both?
c. If the probability of eating potato salad given that someone ate dressing is equal to 0.20 for cases, what is the probability that a case ate both potato salad and dressing?
d. If the probability of eating potato salad given that someone ate dressing is equal to 0.22 for controls, what is the probability that a control ate both potato salad and dressing?
PART TWO: POWER ANALYSIS
Nutritionists at George Washington University want to compare two different diets for a group of diabetic patients. Investigators plan to test the null hypothesis that the mean difference in blood glucose (mg/dL) for patients following Diet 1 will be the same as those patients following Diet 2. The research hypothesis states the mean difference in blood glucose will be different between the two diet groups. Investigators plan to draw their random sample of diabetic patients from the Washington DC area. Recruited patients will be randomly assigned to one of two diets. A fasting blood glucose test will be conducted on each patient at the beginning of the study and again 8 weeks later.
The biostatistician on the project wants to conduct a power analysis to determine the sample size needed to detect differences of 8 to 12 mg/dL. The standard deviation of blood glucose distribution for Diet Group 1is reported to be 13.8 mg/dL; the standard deviation of blood glucose distribution for Diet Group 2 is reported to be to be 16.7mg/dL. The biostatistician wants to estimate the number of subjects needed in each group (assuming equal sized groups) and decides to run an analysis for a two-sample t-Test at a significance level of 0.05 for a two-tailed test. In order to create a thorough recommendation for the study team, the analysis is run at four levels of power (80%, 85%, 90% and 95%).
1) Follow the instructions provided on Blackboard to complete this portion of the assignment. A link to the online power calculator is also available on Blackboard. Calculate the effect sizes (Table 2.1) and sample size estimations (Table 2.2) and fill in the results accordingly:
Table 2.1: Sample size estimations for two-group comparison*
|
Mean Difference in Blood
Glucosefor Diet Group 1
(SD = 13.8mg/dL)
|
Mean Difference in Blood
Glucose for Diet Group 2
(SD = 16.7 mg/dL)
|
Effect Size *
(Cohen's d)
|
|
0mg/dL
|
12 mg/dL
|
|
|
1 mg/dL
|
12 mg/dL
|
|
|
2 mg/dL
|
12 mg/dL
|
|
|
3 mg/dL
|
12 mg/dL
|
|
|
4 mg/dL
|
12 mg/dL
|
|
* Carry these values over into the first column in Table 2.2
Table 2.2: Sample size estimations for two-group comparison*
|
|
Statistical Power |
| Effect Size |
80%
|
85%
|
90%
|
95%
|
|
|
|
|
|
|
|
|
|
|
|
|
|
|
|
|
|
|
|
|
|
|
|
|
|
|
|
|
|
|
* Numbers within each cell represent the sample size per group
2) Describe what patterns you see in the sample size values reported in Table 2.2. What happens to sample size as you read across arow (i.e. as statistical power changes)? What happens as you read down a column (i.e. as effect sizes change)?
3) Choose two cells from Table 2.2 (from two different columns and two different rows) and interpret those values. Remember that the purpose of this power analysis is to provide an estimate for the sample size of the study. So in your interpretation, it is the number in the cell that reflects how many people would need to be recruited per group given the power and the effect size (column and row respectively).
BIOSTAT ASSIGNMENT 2: INTERPRETING CONFIDENCE INTERVALS & PAIRED T-TEST
PART ONE: CONFIDENCE INTERVALS
Suppose that we were to conduct a study in which 30 persons with hypothyroidism were given a new medication to treat the disease. In this study, we measure TSH (thyroid stimulating hormone) before and after the participants have taken the medications for one month. Suppose that we observe a mean difference in TSH levels was equal to 23.7 mg/dL and a standard deviation of differences equal to 49.5 mg/dL. [NOTE: Don't round too soon in the calculation. Report four decimal places in questions 2 and 3; round to two decimals for your final answer to question 4.]
1) Before calculating the 95% confidence interval, it is always a good plan to first identify the values of the elements in the formula in order to complete the calculation. From Dawson and Trapp, we know that the formula for a 95% confidence interval for a mean difference is: Difference ± Confidence factor of the difference x Standard error.
d- ± t(n-1) x SDd/√n
Based on the information provided in the Part One scenario, what are the values for the difference, the confidence factor of the difference, and standard error? [NOTE: You will need to refer to Table A-3 in the textbook to help select the confidence factor. Also, you will need to calculate standard error using the values provided in the Part One scenario. Finally, always use a "0.05 area in two tails" in this class unless otherwise told.]
2) Now that you have those values, calculate the 95% confidence interval (CI). What is the lower and upper bounds of that interval? [Show your work.]
3) Interpret this 95% CI.
4) As an added bonus, CIs can also be used to test a null hypothesis. In this scenario, we are told that the TSH was measured before and after patients took a new medication. Let's assume that the null hypothesis states that the mean difference in TSH will be zero. Consider the 95% CI that you calculated in question 2 above. Does the null value fall inside or outside of that 95% CI? Based on that, would you Reject or Fail to Reject the null hypothesis?
5) Dawson and Trapp discuss the similarities between hypothesis testing and confidence intervals and highlight one noticeable benefit of reporting confidence intervals. According to the authors of our textbook, what is the additional insight that CIs provide that hypothesis testing does not?
Reflect on what you have seen reported within the literature in your own field. Discuss when CIs are appropriate and useful in interpreting results and when they are not. [Cite accordingly]
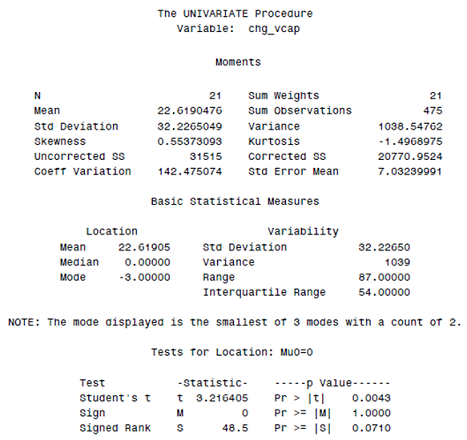
PART TWO: PAIRED T-TEST
Suppose that we are interested in the ability of an inhaled medication to increase vital capacity. To investigate this, we measure the vital capacity of 21 persons before and after treatment. Suppose that we observe the results in Table 1 (see the last page) from SAS when we analyzed our data using the UNIVARIATE procedure.
1) What is the purpose of a Paired t-Test and why is it the appropriate statistical test to conduct in this situation?
2) State the Null and Alternative hypotheses.
3) We can use information from the SAS output to calculate a 95% CI for the estimate of the mean difference. Towards the top of the table, we find the N of 21 and the mean difference of 22.619 mU/L. SAS has also calculated the standard error (7.032 mU/L) for us. We do need to determine the confidence factor of the difference or t(n-1) by going to Table A-3 in the textbook. Calculate and report the 95% CI. [Show your work.]
4) We can also use that information to calculate the test statistic (i.e. the t-score). Dawson andTrapp note the t-score formula as:
t = (d- - 0/SDd/√n)
Note that the denominator in that equation is standard error (which SAS has already calculated for us). Calculate the t-score using the values provided by SAS. Use Table A-3 and determine the critical value for a 0.05 area in two tails. [Don't forget to determine the degrees of freedom (i.e. n-1) for this study in order to select the correct critical value.]
5) Based on what you calculated in question 4 above, what conclusion would you make about the null hypothesis (i.e. would you Reject or Fail to Reject the null hypothesis)?What is your interpretation of the test statistic?
[SIDE NOTE: The following comments and questions are not part of this graded assignment. They are given to help highlight some of the added insights from the SAS output table.
Statistical programs such as SAS do all the work for us. In question 4, you calculated the t-score test statistic. Take another look at the SAS output table - do you see that same test statistic value listed somewhere in the table? If so, notice the reported P-value for that test statistic. Consider the supplemental video about using P-values to test hypotheses. Based on the P-value approach, would you come to the same conclusion as you did in question 5?]
Table 1: Output for Part Two
BIOSTAT ASSIGNMENT 3: INTERPRETING INDEPENDENT T-TEST AND ANOVA
PART ONE: INDEPENDENT T-TEST
Suppose that we are interested in comparing weight lost among persons assigned to either a low carbohydrate diet or a low fat diet. We analyze the data using SAS's TTEST procedure and observe the results shown in Table 1 (see page 6). Based on those findings, answer the following questions.
1) Report and interpret the 95% confidence interval for the mean weight lost for the low carbohydrate diet.[Report two decimal places]
2) Identify the dependent variable and the independent or explanatory variable(s) in this study. Also, state the Null and Alternative hypotheses.
3) An important step in an Independent t-Test is to first test for equal variance. Based on the information in the "Equality of Variances" portion of the output table, what is your decision about the Null hypothesis regarding equal variances (i.e. H0: Variance1 = Variance2)? In your answer, report the test statistic and P-value from the SAS output that you used to make your decision.
4) Now we want to test the Null hypothesis that was stated in Question 2. From the "T-Tests" portion of the output, report the test statistic and P-value that should be used to test the Null hypothesis. Based on that information, what conclusion can you make about the Null hypothesis (i.e. Reject or Fail to Reject the Null)?
5) Write a one-paragraph summary of your interpretation of these findings.Towards the end of your summary, include a discussion about the generalizability of these results. What do the findings mean from clinical perspective?
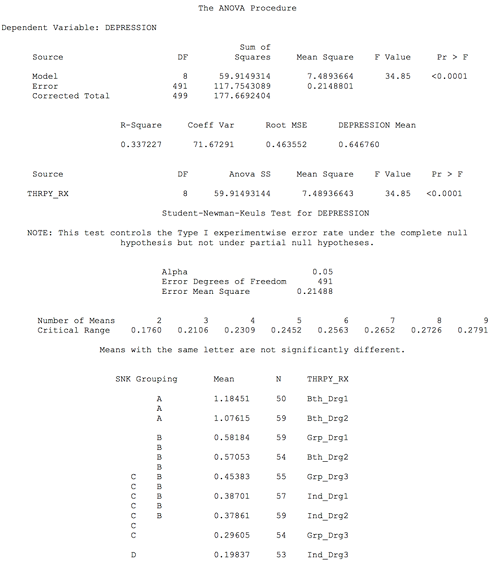
PART TWO: ANOVA
Suppose that we are interested in comparing various treatment options for depression. These treatments include therapy (Group, Individual, or Both) and medication (Drug1, Drug2, or Drug3). We recruit 500 persons and randomly assign them to one of nine treatment groups. In our analysis, we create a variable called "THRPY_RX" to reflect the nine treatment options:
|
Therapy
|
Medication
|
THRPY_RX
|
|
Group
|
Drug 1
|
Grp_Drg1
|
|
Group
|
Drug 2
|
Grp_Drg2
|
|
Group
|
Drug 3
|
Grp_Drg3
|
|
Individual
|
Drug 1
|
Grp_Drg1
|
|
Individual
|
Drug 2
|
Grp_Drg2
|
|
Individual
|
Drug 3
|
Grp_Drg3
|
|
Both Group & Individual
|
Drug 1
|
Grp_Drg1
|
|
Both Group & Individual
|
Drug 2
|
Grp_Drg2
|
|
Both Group & Individual
|
Drug 3
|
Grp_Drg3
|
After six months of treatment, we evaluate the level of depression using a standardized instrument that gives us an index score (DEPRESSION). We are interested in comparing mean index scores across the nine treatment groups. We analyze the data using SAS's ANOVA procedure and observe the results shown in Table 2 (see page 7). Based on those findings, answer the following questions.
1) Identify the dependent variable and the independent or explanatory variable(s) in this study. Also, state the Null and Alternative hypotheses.
2) If this null hypothesis is true, then we would expect to see that the average variation between the means (i.e., the "model mean square" in SAS) is equal to the average variation within each group (i.e., the "error mean square" in SAS). We compare the two mean squares as an F ratio, dividing the model mean square by the error mean square.
Locate the two mean squares on the SAS output table and calculate the F ratio. Show your work.
3) Report the test statistic and P-value from the SAS output. Based on that information, what conclusion can you make about the Omnibus (or Overall) Null hypothesis (i.e. Reject or Fail to Reject the Null)?
4) Based on the information from the Student-Newman-Keuls post hoc test, what THRPY_RX groups are significantly different from each other and what groups are not? [Be sure your answer is thorough ... there's a lot of groups to consider!]
5) Write a one-paragraph summary of your interpretation of these findings. Towards the end of your summary, include a discussion about the generalizability of these results. What do the findings mean from clinical perspective?
Table 1: Output for Part One
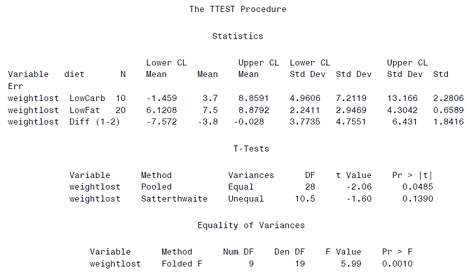
Table 2: Output for Part Two