Reference no: EM131018623
Second Midterm-
PROBLEMS -
1. Suppose the demand curve and supply curve for the market is given by the following equations:
Demand: P = 600 - Q
Supply: P = Q
a. What is the equilibrium price (P1) and quantity (Q1) in this market?
b. When this market is in equilibrium, what is the total revenue (TR1) earned in this market?
c. Suppose that the number of consumers in this market increases such that at every price twice as much of the good is demanded than was demanded initially. In the space below draw a graph that includes the original demand curve (D1), the original supply curve (S1), and the new demand curve (D2). Label the initial equilibrium in this market (Q1, P1) and the new equilibrium (Q2, P2). Label your axes as well.
d. Write an equation for D2 in slope-intercept form.
e. Solve for the new equilibrium quantity and price (Q2, P2). Calculate total revenue (TR2) at this price and quantity. Show your work for full credit.
Q2 = ________________
P2 = ________________
TR2 = _______________
f. Suppose that the firms in this market have the market power to charge whatever price they want. Furthermore, suppose that their goal is to set the market price at that level where total revenue is maximized. What price should these firms charge? Given the new demand curve and ignoring the given supply curve identify the quantity of the good they should sell to reach their goal. What is the value of total revenue (TR3) given this pricing and production decision? Explain your answer making sure to reference elasticity in your answer.
Q3 = ________________
P3 = ________________
TR3 = _______________
2. Martha consumes apples and chocolate candies. Suppose Martha's budget line (BL1) for apples (A) and chocolate candies (C) is given below. Suppose you know that the price of apples is $2 per apple but you are not told the price of chocolate candies or Martha's income.
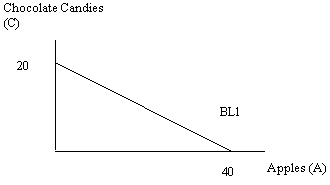
a. Given the graph above, what is Martha's income? Explain how you found your answer.
b. Given the graph above, what is the price of one unit of chocolate candies? Explain your answer.
Suppose Martha's tastes and preferences are such that she maximizes her utility given her budget line when she consumes 28 apples.
c. Given this new information and the above graph, how many chocolate candies does Martha consume when she maximizes her utility subject to the constraints imposed by her income and the prices of the two goods?
d. In the above graph label Martha's optimal consumption bundle on BL1 as point A. Indicate the numerical coordinates of this point on your graph.
Now, suppose the price of apples increases to $4 per apple while there are no changes in Martha's income or the price of chocolate candies. When the price of apples increases to $4, Martha finds she maximizes her utility by consuming 10 units of chocolate candies.
e. Given this new information, in the above graph draw Martha's new budget line (BL2) and indicate the numeric values for the x- and y- axis intercepts.
f. Given this new information, calculate the number of apples Martha consumes when Martha maximizes her utility given the new price of apples. Show your work for full credit.
g. In the graph label Martha's optimal consumption bundle B when the price of apples increases to $4. Indicate the numerical coordinates of this point on the graph.
h. Assume Martha's demand curve for apples is linear. Given the two optimal consumption bundles at A and B, draw Martha's demand curve in the space below and then write an equation in slope-intercept form for this curve. Make sure your graph is labeled clearly and completely labeled. (Hint: the numbers are messy here-just leave them as improper fractions!)
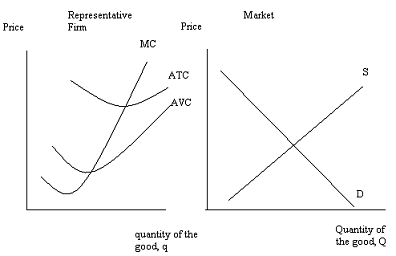
3. Use the graphs below of a perfectly competitive industry and a representative firm in the short run and in the long run to answer this set of questions.
Short-run:
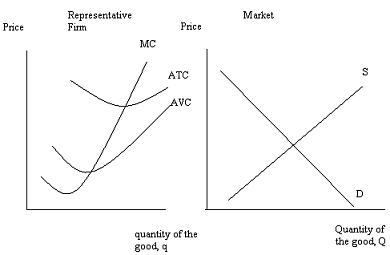
Use the graphs below to answer the questions about the long-run (this graph is just a duplicate of the first set of graphs, but you will be using it to show the long-run adjustment process).
a. In the first row of graphs (the pair of graphs identified as "Short Run") indicates the short-run equilibrium using the following symbols:
Q1 = the short-run market level of production
P1 = the short-run market price
q1 = the short-run level of production for the representative firm
b. In the first row of graphs if the representative firm is earning economic profits shade in the area representing those profits. On the graph indicate whether these are positive or negative profits.
c. Given your analysis in the short-run, what do you predict will happen in this industry in the long run? Explain your answer fully but succinctly.
d. In the second row of graphs (the pair of graphs identified as "Long Run") depict the long-run equilibrium situation in this market. If any demand or supply curves shift, indicate these shifts on your graphs. On the graphs identify:
Q2 = the long-run market level of production
P2 = the long-run market price
q2 = the long-run level of production for the representative firm
e. In the long run, the representative firm in this market will earn ___________________ economic profits.
f. Suppose you are given this set of graphs and told that people's incomes have increased and the good is a normal good. Given this information answer the following set of questions:
i. In the short-run, this change in income will result in the price of the good __________________ relative to its initial level.
ii. In the short-run, this change in income will result in the quantity of the good produced by the representative firm to ______________________ relative to its initial level.
iii. In the long run, the equilibrium price in this market given this change in income and holding everything else constant, will be _____________ relative to the initial long-run equilibrium price in this market.
MULTIPLE CHOICE QUESTIONS-
Use the information below to answer the next two questions:
Your business currently has two customers with the following individual demand curves:
Customer One's Demand Curve: P = 10 -2Q
Customer Two's Demand Curve: P = 20 - 2Q
1. Given this information about your business what is the total revenue (TR) for your business from this market when you set price to be $7.5?
a. TR = $6.25
b. TR = $56.25
c. TR = $100
d. TR = $12.50
2. Your company is trying to decide whether to raise the price of your product from $$7.5 by $0.50 or lower it by $0.50. Given the above information what would you recommend if the sole goal of your firm is to increase the total revenue?
a. The firm should increase the price by $0.50.
b. The firm should decrease the price by $0.50.
c. The firm could increase their total revenue if they increase or decrease the price by $0.50 from its initial price level $7.5.
d. The firm should maintain its current price.
3. Demand for a good is considered elastic. This implies that
a. Increasing the price of this good in the market will result in greater total revenue for producers.
b. Decreasing the price of this good in the market will result in greater total revenue for producers.
c. The market is currently maximizing its total revenue from selling this good.
d. Consumers of this good are not price sensitive.
Use the information below to answer the next two questions.
Shawn and Mary are currently working and living in Tucson. But, they are considering moving to either St. Paul or New York City. The table below provides information about the salaries they would earn in the three cities as well as information about the price index for each city. Shawn and Mary have decided they will move to whichever city provides them the greatest real income. Assume that their nominal salaries and the price index will not change in the future.
|
City
|
Nominal Salary
|
Employee
|
Price Index by City
|
|
Tucson
|
$40,000
|
Mary
|
100
|
|
Tucson
|
$50,000
|
Shawn
|
100
|
|
St. Paul
|
$50,000
|
Mary
|
125
|
|
St. Paul
|
$75,000
|
Shawn
|
125
|
|
New York City
|
$100,000
|
Mary
|
250
|
|
New York City
|
$100,000
|
Shawn
|
250
|
4. From the given information which of the following statements is true?
a. The base year for the price index is this year.
b. Tucson is likely the city that was used to compare the cost of living in other cities when this information was gathered.
c. The cost of living in New York City is 100% higher than the cost of living in Tucson.
d. The cost of living in St. Paul 150% less than the cost of living in New York City.
5. Given that Shawn and Mary want to maximize their joint real income where should they live? Base your analysis solely on the information you have been provided.
a. Shawn and Mary should live in either St. Paul or Tucson since their real income will be equivalent in these two cities.
b. Shawn and Mary should live in New York since both of their incomes are substantially higher than in Tucson or St. Paul.
c. Once you factor in the cost of living for each of these cities the real income in all three cities is the same.
d. Shawn and Mary should live in St. Paul since their real income will be maximized there.
6. The cross-price elasticity of demand measures
a. The percentage change in the quantity demanded of the good to the percentage change in the price of the good.
b. The percentage change in the quantity demanded of one good to the percentage change in the price of a related good.
c. The percentage change in the quantity demanded of the good to the percentage change in income.
d. The percentage change in the price of one good to the percentage change in the price of the other good.
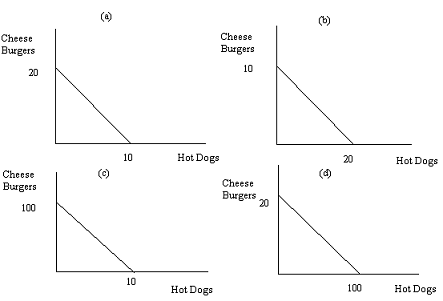
7. Jacob has $100 of income that he will spend on hot dogs or cheeseburgers during his month long vacation. Jacob knows that hot dogs cost $5 each and cheeseburgers cost $10 each. Given this information determine which of the budget lines below represents Jacob's budget line.
Use the following information to answer the next two questions.
Suppose Oscar's income is $1000 and he uses all of this income to buy either ice cream or pizzas. When the price of ice cream is $5 per serving and the price of pizza is $10 per pizza Oscar maximizes his utility by purchasing 40 pizzas. When the price of ice cream is $10 per serving and the price of pizza is $10 per pizza Oscar maximizes his utility by purchasing 60 pizzas.
8. From this information derive Oscar's demand for ice cream. Assume his demand for ice cream is linear. Oscar's demand for ice cream is
a. P = 74 - (8/5)Q
b. P = (1/4)Q
c. P = 100 - (1/2)Q
d. P = 12.5 - (1/16)Q
9. Given the above information you are also told that Oscar's income compensated budget line (the budget line we called BL3 when discussing the income and substitution effects) results in Oscar maximizing his utility when he consumes 100 servings of ice cream and 70 slices of pizza. From this information you can conclude that Oscar's substitution effect with respect to ice cream is equal to
a. 80 units of ice cream.
b. 60 units of ice cream.
c. 30 units of ice cream.
d. 20 units of ice cream.
10. Mary, who prides herself on her business knowledge and expertise, states that no matter what your demand curve looks like it is "always best to charge the highest possible price". Which of the following statements are true given this information? In your answer assume that the demand curve that Mary's business faces for their product is downward sloping and linear.
a. Mary missed the lecture on elasticity in her introductory microeconomics class.
b. If the demand for Mary's product is elastic, Mary will earn more total revenue by lowering the price of her product.
c. If Mary charges the price associated with the midpoint for her product then her company will maximize its total revenue.
d. Answers (a), (b), and (c) are all true answers.
e. Answers (a), (b), (c) and (d) are all false answers.
11. Joey's total utility from consuming 10 cookies is equal to 100 utils. His total utility from consuming 11 cookies is 104 utils. Joey's total utility from consuming 5 slices of pizza is 500 utils and his total utility from consuming 6 slices of pizza is 508 utils. Furthermore, you know that the price of a slice of pizza is twice the price of a cookie. Also assume that Joey has spent all his income on cookies and pizzas. Given this information, which of the following statements is true?
a. Joey is not maximizing his utility from consuming these two goods: he would have greater satisfaction if he consumed more cookies.
b. Joey is maximizing his utility from consuming these two goods: he cannot select a different combination of pizza and cookies that will provide him with greater utility.
c. Joey is not maximizing his utility from consuming these two goods: he would have greater satisfaction if he consumed more pizza.
d. Joey is not maximizing his utility from consuming these two goods: he would have greater satisfaction if he consumed more pizza and cookies.
12. There are five players on the Wisconsin Hotshots, a women's basketball team. The average height of these five players is five feet eight inches tall. If the Hotshots add a new player to the team that is six feet tall then
a. The average height of the team will increase.
b. The average height of the team will be unaffected.
c. The average height of the team will decrease.
d. The average height of the team may increase, decrease or remain the same.
13. In the short run, which of the following statements is true?
a. As output increases average total cost decreases.
b. As output increases average variable cost decreases.
c. No matter what level of output the firm produces, its fixed cost is constant.
d. Answers (a) and (b) are both correct.
e. Answers (a) and (c) are both correct.
f. Answers (b) and (c) are both correct.
g. Answers (a), (b) and (c) are all correct.
14. Katherine operates a bakery in Glenwood. Her costs of operation include $5000 a year in property rental for the land and building where her bakery is located; $1.50 per loaf of bread for the flour, sugar and other ingredients that go into making her product; and $7.00 an hour for each hour of labor she hires. She estimates that she needs four hours of labor to produce 100 loaves of bread, eight hours of labor to produce 200 loaves of bread, etc. Given this information which of the following statements is true?
a. When Katherine produces 400 loaves of bread her labor cost is $28.00.
b. When Katherine produces 400 loaves of bread her fixed costs are equal to $5000.
c. When Katherine produces 400 loaves of bread her variable costs equal $600.
d. When Katherine produces 400 loaves of bread her labor cost is $112.00 while her fixed cost is equal to $0.
15. Consider Monty's Garage, a small business offering car repair. Suppose you are told that as Monty provides more units of his output (i.e., he repairs more cars) his average variable cost is increasing. From this you know
a. That Monty's average total cost is increasing as you move rightward along the quantity axis.
b. That Monty's average fixed cost is increasing as your move rightward along the quantity axis.
c. That Monty's marginal cost of production exceeds his average variable cost of production.
d. Monty can increase his profits by repairing a smaller number of cars.
Use the figure below of a perfectly competitive market and a representative firm to answer the next three questions.
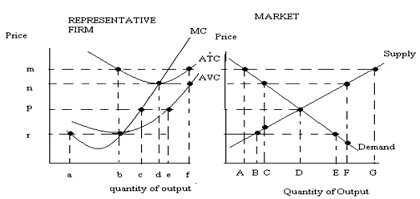
16. In the short run, which of the following statements is true given the above graphs?
a. There are (D/c) firms in the industry and each firm is earning positive economic profits.
b. Firms in the industry are earning negative economic profits and this indicates that the market has too many firms.
c. Each firm's revenue is sufficient to cover their variable costs of production and each firm is earning a normal or zero economic profit.
d. Answers (a), (b) and (c) are all true.
e. Answers (a) and (b) are both true.
17. In the long run, which of the following statements is true given the above graphs?
a. In the long run firms will exit the industry until price increases to "n" and there are (C/b) firms in the industry.
b. In the long run the market supply curve will shift to the right until prices fall to "r" and there will be (E/b) firms in the industry.
c. In the long run the market supply curve will shift to the left until price is "n" and each firm is producing "d" units of output.
d. In the long run the market demand curve will shift until all firms in the industry earn zero economic profits.
18. In the long run, which of the following statements is true given the above graph?
a. Total revenue for the industry will equal n*C and total revenue for the representative firm will equal n*d.
b. Total revenue for the industry will equal n*F and the total number of firms in the industry will by F/d.
c. Total revenue for the industry will equal n*F and total revenue for the representative firm will equal the firm's fixed costs.
d. Total revenue for the industry will equal n*F and the representative firm's total costs are equal to its variable costs.
19. A firm in a perfectly competitive market is currently producing 10 units of output and its average cost of production is $2 per unit of output. The firm also knows that if it increases its production to 12 units, its average total cost of production will increase to $2.25 per unit of output. This information implies
a. That the firm needs to increase its level of production to reach the long run equilibrium price and quantity in this market.
b. That the firm will maximize profit by producing 10 units of output in the long run.
c. That the equilibrium long run price in this market is $2.
d. That the firm may need to decrease its level of production in the long run in order to reach the long run equilibrium price and quantity in this market.
20. A firm experiences increasing returns to scale. This indicates that
a. The firm's average costs of production fall as the size of the firm increases.
b. The firm's average costs of production fall as the firm hires more of its variable inputs holding everything else constant.
c. The firm's average variable cost of production reaches its minimum point at a relatively low level of production for the firm.
d. The number of firms in the industry should increase in the long run to take advantage of the increasing returns to scale.