Reference no: EM131017773
Consumer Theory - Deriving a Demand Curve:
1) The goal of this problem is to highlight the connection between Consumer Theory topics like utility and budget lines, and our understanding of downward sloping demand curves.
Joe is a student who can spend his income on either Chipotle burritos or Noodles & Co. salads. These two meals are substitutes for each other, but Joe's optimal consumption includes a mix of burritos and salads. Joe's budget constraint is given by the formula:
Y = PBB + PSS
Where Y is the amount of income Joe has, PB is the price of a burrito, B is the number of burritos he eats, PS is price of a salad, and S is the number of salads he eats.
a. Initially, Joe has Y = $100, and the prices of burritos and salads are each PB = PS = $5. Graph Joe's budget constraint, with burritos on the horizontal axis and salads on the vertical axis. We will be adding more lines to this graph, so be sure to leave lots of extra space on the horizontal axis!
b. At this initial set of prices, Joe's optimal consumption bundle is (B = 10, S = 10). Mark this point on your graph. (This point should lay directly on Joe's budget line, so double check your numbers.)
c. Chipotle now announces a special burrito sale, where the price of burritos will now be PB = $2.5. What is Joe's new budget constraint? Add this new line to your graph from part (a).
d. With this burrito sale, Joe's new optimal consumption bundle is (B = 30, S = 5). Add this point to your graph as well.
e. Finally, Chipotle realizes they made a huge mistake with their burrito sale, and now have to go out of business. But before they do, they have one last closeout sale, lowering the price of burritos to PB = $1. What is Joe's budget constraint now? Add this new line to your graph from part (a).
f. With this super low closeout sale price, Joe's optimal consumption bundle is (B = 80, S = 4). Add this final point to your graph.
g. Now we can go back to our graph and see the quantity of burritos Joe will buy when the price, PB, is at three different levels. To make a new graph, showing Joe's Demand Curve for burritos, we can use these three different points. Think carefully about which quantities and prices should be on each axis, and then plot Joe's three optimal burrito consumption points on the graph. Add a line that goes through these points (it may be curved), and it should trace out a possible demand curve!
Production and Costs:
2) Sarah owns a custom t-shirt business in Madison. The quantity of t-shirts that her company can produce (q) depends on the amount of capital (K) and labor (L) that she employs. The units of capital represent the number of screen-printing machines her business owns. The units of labor represent the number of employees she hires. Her costs of employing the capital and labor are given in dollars. The following table describes the production and costs for given levels of K and L
|
K
|
L
|
q
|
FC
|
VC
|
TC
|
AFC
|
AVC
|
ATC
|
MC
|
MPL
|
|
2
|
0
|
0
|
|
|
50
|
-
|
-
|
-
|
-
|
-
|
|
2
|
|
2
|
|
|
|
|
|
|
$5/unit of output
|
2 units of output/unit of labor
|
|
2
|
2
|
5
|
|
|
|
|
|
|
|
|
|
2
|
|
10
|
|
|
80
|
|
|
|
|
|
|
2
|
4
|
|
|
|
|
|
|
|
|
|
|
2
|
5
|
25
|
|
|
|
|
|
|
|
5
|
|
2
|
|
30
|
|
70
|
|
|
|
|
|
|
|
2
|
9
|
32
|
|
|
|
|
|
|
|
|
a. How much does each screen-printing machine (unit of K) cost?
b. How much does each unit of labor cost? You can assume that this wage is constant.
c. Fill out all the other missing pieces of information in the table. Make sure that you answers are consistent with the values that have been provided.
d. As Sarah hires more workers, does the marginal product of those workers (the MPL) increase? Does marginal product of labor begin to diminish at some point?
e. Can we tell whether Sarah's business will be operating in the short run? What about in the long run? What piece of information do we still need to learn to know for sure?
f. Let's say that the price of t-shirts is $2. How many t-shirts would Sarah's business produce? What would be her profit or loss?
g. At what Shutdown Price would Sarah stop producing any t-shirts at all?
h. What is the Breakeven Price for Sarah? This is the price at which she makes exactly zero profits in the long run.
Perfect Competition:
3) Madison is a town with many, many coffee shops. These shops are mostly the same size, and they produce similar food and drinks using similar equipment. A group of economics students runs one of the shops, called Econocoffee. Like all the shops in Madison, their total and marginal cost curves are given by:
TC = .1q2 + 10
MC = .2q
Where q is the number of coffees sold by Econocoffee. Because there are so many coffee shops, Econocoffee must take the equilibrium price as given when choosing how much to produce.
a. Which part of Total Costs are Fixed Costs? Which part represents Variable Costs? Write down the equations for Econocoffee's Average Total Cost (ATC) and Average Variable Cost (AVC).
b. Graph Econocoffee's ATC, AVC, and MC curves on the same graph. A good approach here is to try plugging in a few points for each curve.
c. What are the Breakeven and Shutdown prices of coffee for Econocoffee? Mark these points on your graph.
d. Econocoffee is not the only shop in town. Assume that all of the coffee shops in town have identical costs and identical coffees, and that the market is perfectly competitive. Given this information, what is the long run equilibrium price, and how much coffee does each firm produce?
Suppose we know that the demand curve for coffee in Madison is given by:
Demand: P = 10 - .05Q
Where Q is the number of total coffees purchased from all shops.
e. Given this new information about demand, and based on what we calculated in part (d), how many total coffees will be sold in Madison? How many coffee shops are there in business?
Now there is a change in the market, as a huge new apartment complex called the Hub opens on State Street. This brings an influx of under-caffeinated consumers into the market, and the demand for coffee increases:
New Demand: P = 12 - .05Q
f. In the short run, all coffee shops cannot adjust their fixed costs, and new shops cannot open. The only things that businesses can adjust are P and q. What will be the new short run equilibrium price for a coffee? What is the total quantity sold, and how much is sold by each shop?
g. At the new short run equilibrium prices and quantities, calculate the profit being earned by Econocoffee.
h. In the long run, new businesses can firms can enter and old businesses can exit. Given the profits calculated in part (g), will new coffee shops want to enter in the long run? Or will existing shops want to exit?
i. Calculate the long run number of coffee shops that will exist in Madison now that the new apartment complex has opened. What happens to the profit made by firms once we are back in long run equilibrium?
Graphing Perfect Competition:
4) For this problem, think about a perfectly competitive market for organic vegetables. Many small, identical farms supply the organic vegetables.
The aggregate demand for organic foods in the whole country is given by a standard downward sloping demand curve. Each farm takes the equilibrium market price as given, and decides how much to produce.
We want to graph what supply, demand, and costs look like for each individual firm, and for the market as a whole. Or initial long-run equilibrium, say in the mid 2000's, is graphed below:
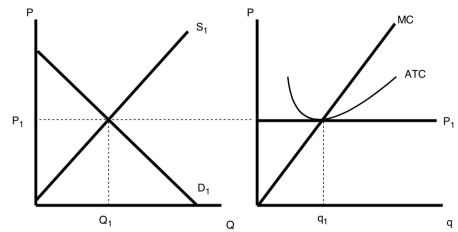
The graph on the left shows market supply and market demand. The graph on the right shows the prices and costs faced by the individual farms in this market.
a. First, redraw the two graphs above, leaving room below for two additional pairs of graphs. Make sure to mark the price (P1) and the market (Q1) and firm (q1) quantities. Are the farms making any profits in this equilibrium?
During the last few years, a lot of people have gotten very interested in how their food is produced, and want to consume more certified organic foods.
b. In the short run of the past few years, what change would this have on the aggregate market? Remember that in the short run, firms (farms in this case) cannot enter or exit the market. Draw two new graphs showing how this increased interest in organic vegetables has changed the market. Mark the new short-run equilibrium price and quantity variables (P2, Q2, q2).
c. Are the individual farms making any profits in this short-run equilibrium? If so, mark the area on the graph that represents these profits.
In the long run, existing farms are able to exit the market, and new farms are able to enter.
d. Based on the answers to (b) and (c), will farms want to exit or enter the organic vegetable market?
e. Draw two new graphs showing the new long-run equilibrium now that farms are allowed to enter and exit. Mark the new long-run equilibrium price and quantity variables (P3, Q3, q3).
f. In this long run equilibrium, are the farms making any profits? If so, mark the area on the graph that represents these profits.
5) Now we want to think about the perfectly competitive market for sugar. The approach will be just as in the previous problem.
a. Begin by drawing two graphs representing a long-run equilibrium at the market level, and from the perspective of an individual sugar farm. Again be sure to mark (P1, Q1, q1).
b. In the initial long-run equilibrium, are farms making positive, negative, or zero profits?
Food scientists have recently developed a number of new artificial sweeteners, which are good substitutes for sugar in many foods and drinks.
c. What short-run effect would the introduction of these sweeteners have on the sugar market? Draw two new graphs to demonstrate how this affects the market as a whole, and the individual firms. Mark the new short-run equilibrium's P2, Q2, and q2.
d. In this new short-run equilibrium, are farms making positive, negative, or zero profits?
In the long run, sugar farmers can adapt to this market shift and enter or exit the sugar market.
e. Will farmers be entering or exiting sugar farming? What fact drives this choice?
f. Draw two more graphs based on the new long-run equilibrium that results from the introduction of the artificial sweeteners. Mark P3, Q3, and q3 on the graphs.
g. Combining the results seen in this problem and problem (3), what might a rational farmer decide to do based on the market changes he or she observes? (Note: this question was written by a grad student who knows nothing about farming. What potential issues might make this harder to do in real life than in our simple economic model?)
Exercise Looking at Careers:
6) For this question go to the blog "Life's Curiosities: An Economist's Perspective". You can find this blog at https://www.billkellyassociates.com/. Once you are at the site, look around a bit and then proceed to this question.
Looking on the "Contents" page scroll down until you find "6. What's a Student to Do?" and "7. Amazing Career Database".
a. Read the whole entry "What's a Student to Do?" and then read the entry "Check Out an Occupation". Study these articles carefully. What would you say are the two most important things to know from these articles? Write a short paragraph that highlights at least two points that you found interesting in these two entries. How did these readings impact you? Did you learn something or did you find your thinking about your education altered because of these readings? Be thoughtful here. If you would like, shoot Bill Kelly a short (or long) email about the experience: his email is [email protected]. (We want you to be part of our "focus group".)
b. Now go to the websites discussed in the article "Check Out an Occupation". Use the websites that are referred to in this article to research a potential career you think you are interested in. Find out information about this career from this data set. What is the salary for the top 10% of earners in this career? What is the salary for the bottom 10% of earners in this career? What particular skills and attributes are necessary to work in this profession?
c. Repeat this process for another career that you think you might be interested in pursuing. I want you to look into careers that you find attractive or compelling since we are talking about YOUR LIFE.
d. For each of the careers you explored in (b) and (c) write separate paragraphs where you evaluate your current strengths, interests and attributes with regard to the specific career you researched. Do you think you are a potentially good fit for the career you researched? If yes, explain why. If no, explain why. There should be two paragraphs minimum here since you are researching two different careers.
e. Write a final paragraph about how this experience impacted you. Did you learn anything from the experience? Were you introduced to datasets that were new to you? Did you find the undertaking an insightful experience? Expand on your answers here.