What is difference between microeconomics vs macroeconomics

Assignment Help Microeconomics
Reference no: EM131210535

Economics Assignment

Activity 1 - The Budget Constraint

Graph an example of a budget constraint (or the consumption choice opportunity frontier) for the purchase of two different goods or services. State the budget in the form of an equation (Budget = P1*Q1 + P2*Q2). Calculate the slope of the line and interpret in words what the slope means.

Activity 2-­- Key Terms

Define the following terms:

1) Marginal Analysis -

2) Utility-­-

3) Law of Diminishing Marginal Utility-­-

4) Sunk Costs-­-

Activity 3 - Straight-­-line Production Possibility Frontier (PPF)

Construct a straight-­-line PPF relating the production of two goods for an individual business firm. Calculate and interpret the slope of the PPF. Show a point that is "inefficient" (idle resources), a point that is "efficient" (full employment), and a point that is "unattainable".
Explain what a movement along the curve means. How is the budget constraint similar to and different from a PPF?

Activity 4 - Bowed-­-out Production Possibility Frontier (PPF)

Construct a bowed-­-out PPF relating the production of two goods for an entire economy. Explain what happens to the opportunity cost of production as more of one good is made. How could the PPF experience economic growth? Show what that would look like. How does this relate to law of diminishing returns?

Activity 5 - Comparative Advantage, Trade, and the PPF

Graph two different economy's PPF, illustrating the concept of comparative advantage. In order for the consumers of each country to be better off, explain which good each country should export to and import from the other.

Activity 6 - Positive vs. Normative Statements

Explain the difference between positive statements and normative statements by giving an example of each. Are budget constraints and PPFs positive or normative by their nature? How do consumers (budget constraints) or entire society's (PPF) declare normative statements by their decision on the graph?

1. Define "economics"

2. Who is Adam Smith, and why is he famous?

3. What is meant by "division of labor"? How does it work?

4. What is the difference between Microeconomics vs. Macroeconomics?

5. Contrast "monetary policy" from "fiscal policy".

6. Recreate and explain the circular flow model (you may use the whiteboard)

7. Contrast: Traditional Economy, Command Economy, Market Economy

8. What is globalization? Relate this to imports/exports

The Algebraic Models

1. A. Identify each component of the linear equation:

Y = m * x + b

2. In words, what does this tell us about the relation between the x variable and the y variable?

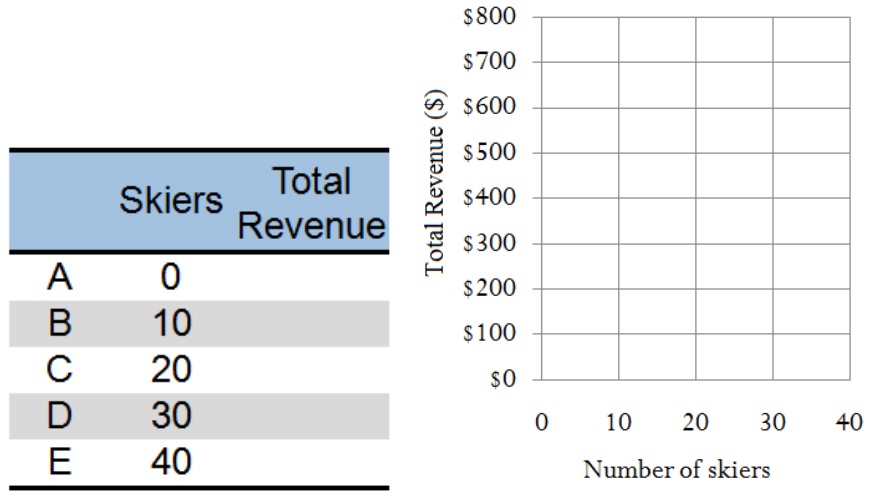
Scenario 1: College Ski Club

A college ski club organizes day-­long bus trips to a ski area each semester.

• The club charges $15 per passenger
• The club receives a $100 grant from the student government per semester.

1. Based on the information above, fill in the total revenue that the Ski Club brings in on the table, based on the number of skiers it recurits. Next, Graph Points A-­E on the graph associated graph.

331_Graph.jpg

2. Calculate the slope of the line you drew above. Interpret in words what the slope tells us.

3. Determine the linear equation that represents this data (remember: Y = mX + b).

4. Assume that the student government increases the student club grant to $300 instead. Show how this impacts the graph.

5. Instead, assume that the Ski Club increases ticket prices to $20 (student government still grants $100 each semester). Show how that impacts the graph.

Scenario 2: Speeding is Bad for Your Budget

Assume that for every 5 miles per hour (MPH) that one drives over 65 MPH, the average car's fuel economy (measured in miles per gallon, or MPG) decreases by 2 MPG. If a car travels exactly at 65 MPH, then it has 40 MPG.

6. Graph this relation as a line graph, putting the independent variable on the x-­axis and dependent variable on the y-­axis.

7. Calculate the slope of the line.

8. Interpret the slope of the line in words.

Scenario 3: Hiring Waiters in a Small Restaurant

You are a manager of a small restaurant, and you need to know how many waiters should be staffed (depending on anticipated number of tables to be served). Based on past experience, you have collected the following data.

Total Number of Waiters Staffed

Total Number of tables Served

0

0

1

8

2

14

3

18

4

20

5

20

9. Make a line graph of the data above in the space below.

10. Estimate the slope at two different points on the graph. Show on your graph.

11. What is happening to the slope of the line as more waiters are being hired?

Line Graphs, Pie Charts, and Bar Graphs

12. Create your own examples of each of the types of graphs below. You may make up your own data, but make sure to fully label all parts of the graphs and charts!

a. Line Graph

b. Pie Chart

c. Bar Graph

13. For each relation of data, label whether it is best to use a line graph, pie chart, or bar graph to represent the data.

a. The percentage of the population by religious affiliation:

b. The number of hours playing video games by age groups

c. The average number of dogs walked in a community (in a week) by outside temperature

d. Average number of calories consumed by country

e. Number of houses built by year

f. Students' favorite color at a school

g. The GDP of 10 countries, in order from highest to lowest.

Reference no: EM131210535

Questions Cloud

Explain what the reader must know about the organization : In one-to-two pages, explain the conclusions of the data analysis addressing the specific strategies that were successful, which strategies did not work as well as was anticipated, and how the strategies support the research questions.
Managers manipulate reported earnings : Discuss some of the reasons managers manipulate reported earnings. Explain why earnings smoothing, one form of earnings manipulation, could be justified and why ethical analysts might avoid stocks from corporations that are known to smooth earning..
What is the real after tax return : The nominal interest rate is 3 percent, but people expect prices to fall by 4 percent. What is the real interest rate?
Scenarios for stock prices : What will be the profit to an investor who buys the call for $4 in the following scenarios for stock prices in 6 months? What will be the profit in each scenario to an investor who buys the put for $6?
What is difference between microeconomics vs macroeconomics : What is the difference between Microeconomics vs. Macroeconomics? Contrast "monetary policy" from "fiscal policy". Recreate and explain the circular flow model (you may use the whiteboard)
List the pids of parts with the highest cost : How would your answers to the above two questions change, if at all, if your system did not support indexes with multiple-attribute search keys?
Good short-term financial strength : A company has $100,00 in cash, $300,000 in accounts receivable, $50,000 in inventory and a $300,000 office building. Its current liabilities are $250,000. What is the company's current ratio, and does that ratio good short-term financial strength?
What is the sustainable growth rate of output over time : Draw the long- run aggregate supply curves for successive long- run equilibriums with a potential growth rate of real GDP at 2.5 to 3.0 percent per year.
Write a client-server program : Write a client-server program. The server has the following properties: It wait for requests at port 12345. It will create a thread to serve one incoming request

Reviews

Write a Review

Microeconomics Questions & Answers

  Find the profit maximizing level of output and price

Assume the market demand for a good is Q = 2500 - 20 P0.8- Find the profit maximizing level of output and price.

  Consider the graph belownbsp it contains 2 separate demand

consider the graph below.nbsp it contains 2 separate demand curves d1 and d2 the marginal revenue curve associated with

  Calculate low-chromium diet mean minus the normal diet mean

Create a list of these 10 randomizations (one of which is the original assignment of observations to the two groups) and for each case calculate the low-chromium diet mean minus the normal diet mean.

  Have keynesians contributed anything keynes general theory

Does the modern classical approach provide an adequate analysis of the economic conditions in recessions and depressions, or does the profession still need the Keynesian approaches for its analysis?

  A manager hires labor and rents capital equipment

A manager hires labor and rents capital equipment in a very competitive market. Currently the wage rate is $15 per hour and capital is rented at $8 per hour. If the marginal product of labor is 45 units of output per hour and the marginal product of ..

  Conduct research on the economic performance of singapore

Discuss the performance of the economy over those ten years and provide evidence and explanations for the economic performance such as a high unemployment rate, high inflation rate and/or steady, long-term economic growth.

  Describe how the number of firms and competition varies

What kind of market structure is the fast food industry and diamond industry? How do you know this to be true?

  Was having that business open a sensible choice by theresa

If a firm’s expansion path is a straight line starting on the origin, that implies that we have constant returns to scale (Hint – think of the Cobb-Douglas production function).

  Which role of thinking do you think you would fit in

What role do monetarists believe the government should play in the economy and why After that has been discussed, What do Keynesian and New classical economists believe about macroeconomic policy. Which role of thinking do you think you would fit ..

  Can we perform granger causality test with vecm

What can you conclude about the relationship between these three interest rates? How do you select the lag length for Granger Causality test?

  Economic theory used to complete the policy solution

Briefly describe the economic problem you have selected - Assess the impact the problem poses to society and design an economic policy solution to the problem.

  Explain exactly how change in federal funds rate can

according to the federal reserves federal open market committee 2011 the federal reserve controls the three tools of

Free Assignment Quote

Assured A++ Grade

Get guaranteed satisfaction & time on delivery in every assignment order you paid with us! We ensure premium quality solution document along with free turntin report!

All rights reserved! Copyrights ©2019-2020 ExpertsMind IT Educational Pvt Ltd