Reference no: EM13551540
Question 1 : Production - Cost and marginal costs
Fangorn Inc., a forestry firm, faces a constant marginal cost for producing firewood of 2 gold coins per cord. As the firms uses very rudimentary equipment, its fixed costs are only 10 gold coins.
a) Draw a picture showing both the marginal cost curve and the total cost curve for Fangorn Inc.
b) What is the shape of the cost curve in this case? Can you conclude something more general about cost curves when marginal costs are constant?
Beaver Forestry Corporation, another forestry firm, produces according to the marginal cost curve (in red) and total cost curve (in green) illustrated below.
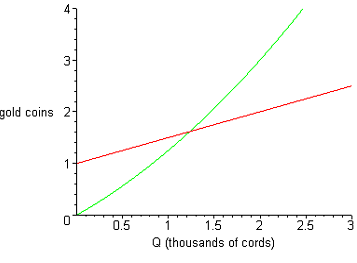
c) What are the fixed costs for this firm?
d) If the market price is 2 gold coins/cord, how much will Beaver Forestry Corporation produce?
e) What will be the firm's revenues from this level of production? What will be its total costs? What about profits? (hint : profits are just the difference between revenues and total costs)
f) What will happen if the price of firewood decreases to 1.5 gold coins/cord? What if it falls to 0.75 gold coins/cord?
Question 2 : Maximizing net benefits in the presence of an externality
The graph shows the supply and demand for widgets in Utopia. Unfortunately, scientists in the country have just found out that the production of widgets creates an externality of 10$ per widget produced. As the government of the country always seeks to maximize net benefits (now you see why it's called Utopia!), the prime minister therefore decides to intervene by setting a tax on the production of widget.
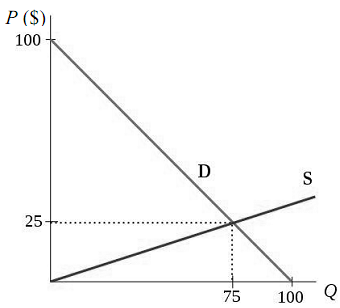
a) What should be the amount of the tax? Draw a graph representing the situation.
b) The following year, scientists find out that the externality has increased to 12$ per widget, and will be increasing by 2$ per widget each year in the forseeable future. How should the government adapt its policy to respond to this new information?
Question 3 : Maximizing net benefits in the presence of an externality
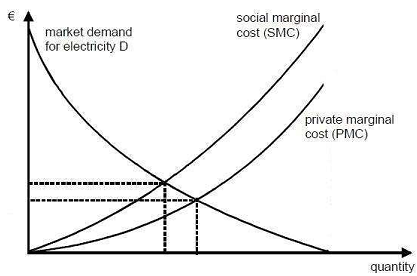
Below is a picture of the market for electricity in a european country.
a) What are the efficient price and quantity on this graph? What are the free-market price and quantity?
b) Reproduce the graph, and show on the graph the following :
i. The amount of the marginal external costs at the efficient outcome and at the free-market outcome. Call them respectively e*and e
m. Which is larger?
ii. The deadweight loss of the free-market outcome (explain how you obtained that answer)
c) Now draw this same graph, but in terms of the marginal cost and benefit of pollution. Here you can just sketch what the graph will look like : don't try to be too precise, just make sure that the curve look right qualitatively.
d) Now do the same thing, but in terms of marginal cost and benefit of abatement.
e) On your graphs for (c) and (d), indicate :
i. The efficient and free-market outcomes
ii. The amount of the marginal external costs at the efficient outcome and at the free-market outcome.
iii. The deadweight loss of the free-market outcome (explain how you obtained that answer)
Question 4
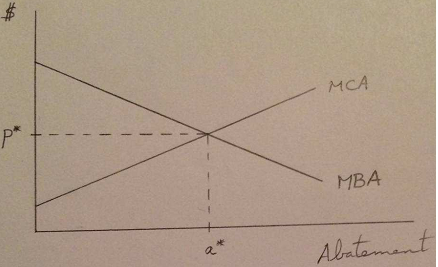
Use the graph below to show that the point (a*, p*) is the only one that maximizes net benefits.
Question 5
A pollution control agency is considering the following regulatory policies:
(i) Taxing the use of one input that increases pollution. (Other inputs affect pollution too, both increasing and decreasing it.)
(ii) Taxing the final goods that firms produce and sell on the market.
(iii) Taxing pollution.
For each of the following questions, explain why you have answered with the policy that you have, and explain why you have chosen that policy over the other two.
(a) Which of these policies is most likely to reduce pollution?
(b) Which of these policies might actually lead to an increase in pollution?
(c) Which of these policies is most likely to be financially damaging to firms?
(d) Which of these policies is most likely to encourage innovative methods of pollution reduction?
Question 6
Two pollution sources are located in the same town, immediately next to each other. For every quantity of abatement, marginal costs of abatement for the first source are higher than marginal costs of abatement for the second source.
(a) If both the tax and standard achieve the same level of total emissions, is a uniform pollution tax more cost effective than a uniform pollution standard (that is, a tax or a standard that is the same for both sources), less cost effective than a uniform standard, or are you unable to tell? Why?
(b) Would the sources prefer to face a pollution subsidy or a marketable permit scheme, if permits are distributed at no cost based on the standard in (a), and both the subsidy and the permit scheme achieve the same level of total emissions? Why?
Question 7
In the figure below, MB1 is the marginal benefit that town 1 gets from abatement; MB2 is the marginal benefit for town 2. MC, A is the marginal cost of abatement for source A, and MC, B is the marginal cost of abatement to source B. In both cases, the pollution is local, that is it affects only the city in which the source is located. Use the figure below to answer the following questions.
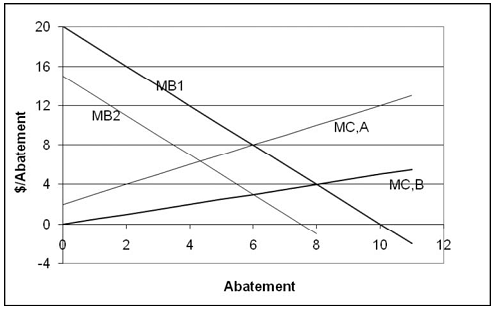
(a) If source A is located in town 1, what is the efficient level of abatement for town 1? Why?
(b) If source A is located in town 1, what level of pollution tax will achieve the efficient level of pollution for town 1? Why will that level of tax achieve the efficient level?
(c) If source A is in town 1, and if source B is in town 2, is a uniform pollution tax or a uniform pollution standard (that is, a tax or a standard that is the same in both places) more efficient? Why?
(d) If source A is in town 2, and if source B is in town 1, does that change your answer in (c)?