Reference no: EM13972877
Part 1
Using data in Excel file comparison.xlsx, construct four graphs and one table as follows. Your graphs and table will be based on the years 1945 to 2015, rather than the longer period in Siegel, and include data on only two assets: S&P 500 total returns and US Gov. Bond total returns (and cash in Graph 1). The CPI is also included so that you can construct real values and real returns.
Graph 1: Replicate Fig. 1.1 in Seigel, based on the real value of the S&P 500 total return index, Government Bonds, and cash.
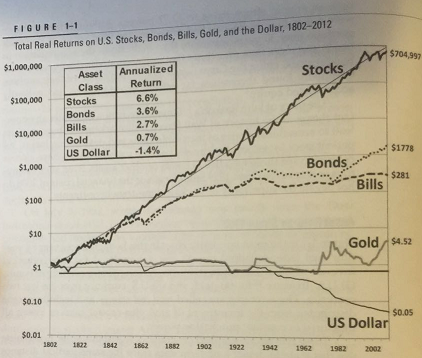
For stocks and bonds, construct the real value by dividing each index by the price level, the CPI divided by 100. Then construct the real rate of return by the percent change from year to year. You want all the investments to begin at the value 1. One way to do this is to start at 1 and then increase the next year's value by the real increase of that index. For example, if stocks increased by 3% from 1945 to 1946, and 5 % from 1946 to 1947, the value would be 1 in 1945, 1.03 in 1946, and 1.03(1.05)=1.0815 in 1947.
For cash, just compute the real value of $1 with 1945 as the base year of the CPI. Be sure to use the logarithmic scale, an option on the vertical axis menu of Excel.
Graph 2: Present a bar graph of the annual real total return to the S&P 500 and indicate on the graph with three lines the average annual return, and plus and minus two standard deviations from the average annual return. (This is the only graph not shown in Seigel, so an example will be discussed in lecture.)
Graph 3: Replicate Figure 6-2 in Seigel for the S&P 500 total returns only for 1,2, 5, and 10 year holding periods.
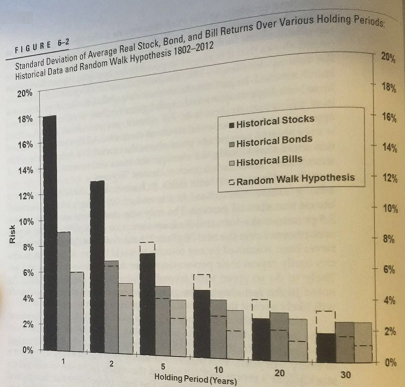
For this graph, first compute the annual real return based on continuous compounding. (Continuous compounding works better here since the average return of the longer holding periods is then just the average of the one year returns. For example, the average return to a 5- year holding period is the average of 5 one-year holding periods.)
Allow holding periods to overlap. For example, the average return to the two year holding period 1946-1947 is simply the average of the returns in 1946 and 1947. The next two year holding period is 1947-1948, and so forth.
Graph 4: Replicate Figure 6-4 in Seigel for only the 1 year holding period. Your graph should show 11 distinct combinations of stocks and bonds, following the computations in Estrada page 49, Table 5.2. (You are using the S&P 500 and government bonds instead of Boeing and IBM, of course. Please use real returns here also.)
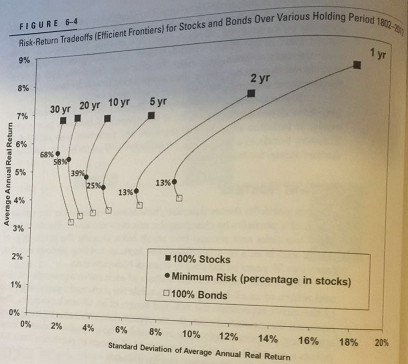
Table 1: Neatly summarize with clear labels the following information: the compound average annual real return to stocks, bonds, and cash (as in the box on Fig 1.1 of Seigel).
ALL GRAPHS SHOULD BE CLEAR AND LARGE (AT LEAST ½ PAGE), with neat titles
(including graph number), legends, and axes labels. You should be able to look at the graph alone and know what it presents. Take the time to format all elements in the graph and tables, like axes numbers and percentages, as simply as possible with no extraneous decimals. Use Seigel's graphs and tables as a guide. You must attend class and discussion sessions regularly for further guidance. DO NOT TURN IN THE
RAW DATA, JUST THE GRAPHS!
Part 2. Essay: Are stocks a good long-run investment?
In this part you will evaluate Seigel's main argument that stocks are a good investment for the long-run. Write a two-page essay (typed, double spaced) that explores this argument by answering the following questions. Since this is an essay, do not include the questions or the numbers, but be sure to address all the questions and points. (You may change the order if it helps your essay.) A brief introduction that explains your main theme - stocks for the long run - is a great way to start.
Refer to the graphs in your answers by their respective numbers. For example, you could write, "As we can see from Graph 2, stock returns were highest in year x, when investors earned x % return." Your essay will be evaluated on clarity and originality, and should be in grammatically correct English.
1. Suppose you invest in the stock market for one year only during the period from 1945 to 2015. Based on Graph 2 what and when is the highest return you could have earned and the lowest return you could have earned? Based on the normal distribution, what range would you expect your return to fall in about 95 percent of the time? (See also Estrada page 27.)
2. Diversification reduces risk and one way to diversify is by investing in a longer period. Based on Graph 3, summarize the advantages of a longer holding period in terms of reducing risk. If you have a ten year holding period, what and when is the highest return you could have earned and the lowest return you could have earned?
3. Another way to diversify is by holding a portfolio of different assets. Based on Graph 4 and the discussion in Estrada Chpt. 4, identify and explain the minimum variance portfolio and the efficient set.
4. The data in Graph 1 and Table 1 show the long run return to investing in stocks compared to other assets in the past. Suppose you invest today $1000 in a diversified stock portfolio, $1000 in bonds, and $1000 in a safe deposit box. Further suppose inflation averages 2 percent per year for the next 50 years. Assuming real returns are the same as in the past, how much will each of these investments be worth in 50 years in today's dollars?
5. Do you agree with Seigal that stocks are a good investment for the long-run? In particular, do you think past stock performance is a good guide to future returns? Why or why not?
Attachment:- comparison.xlsx