Reference no: EM131092529
1. Setup Excel Data Analysis Toolpak
The Analysis ToolPak is an Excel add-in program that adds extra financial, statistical, and engineering functions to Excel's pool of built-in functions. The tools included in the Analysis ToolPak enable you to analyse worksheet data by using descriptive statistics. Correlation, regression, ANOVA etc.
Although the Analysis ToolPak comes with Excel, it doesn't come pre-installed. Before you can use the statistical functions added by the Analysis ToolPak, you must install and load it as follows:
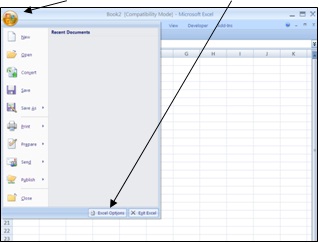
1. Click the Microsoft Office Button, and then click Excel Options.
2. Click Add-Ins, and then in the Manage box, select Excel Add-ins and click Go.
3. In the Add-Ins available box, select the Analysis ToolPak check box, and then click OK.
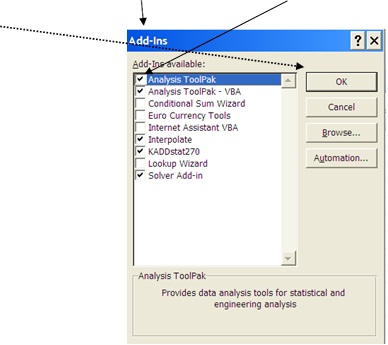
4. If you get prompted that the Analysis ToolPak is not currently installed on your computer, click Yes to install it.
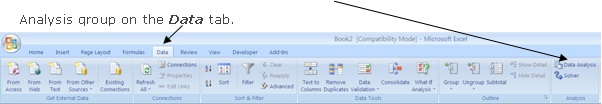
5. After you load the Analysis ToolPak, the Data Analysis command is available in the
Note: Mac users may require following different procedure. Please try the link below for assistance.
https://support.microsoft.com/en-us/kb/2431349
2. Charts & Graphs (GDP data)
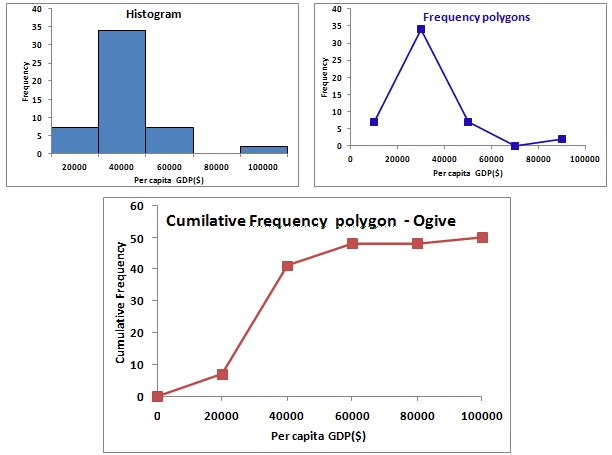
Table 2.1 (GDPData.xls) contains raw data on the top 50 countries as measured by per capita gross domestic product (GDP). In this example, you are required to prepare frequency distributions and plot histogram, frequency polygon and Ogive. You are required to use Data analysis ToolPak plug-in in Excel.
Step 1: Sort data to find maximum, minimum and calculate range (max-min).
Step 2: Assume number of classes as 5 and type "bins" in Excel.
Step 3: Plot histogram and prepare frequency/cumulative frequency distributions. Step 4: Produce a frequency polygon and a cumulative frequency polygon (Ogive)
Note: Your graphs should look similar to the illustrations given below.
3. Attempt resources/problem sets under week 1 in Aplia
|
Implication of hiring contingent worker
: Implication of hiring contingent worker in both perspective organization and worker1Benefits using contingent worker2. Practical risks of contingent workers for organization
|
|
Develop recommendations for additional e-services
: Develop recommendations for additional e-services for your chosen State Educational Website (Idaho). Distinguish between those services that provide support to parents, educators, or community at large.
|
|
Determining the theories of motivation
: The purpose of this assignment is to apply the motivation and job satisfaction theories to a specific situation. Describe the theories and key assumptions on what motivates people or makes them satisfied. Apply one of the theories to a specific si..
|
|
Math and legal provisions give her a headache
: Jane walks into your office. She tells you that she has a husband, Mike, of 10 years. Jane and Mike have 4 children named Adam, Bertha, Carl and Donna. Mike has 3 children from a previous marriage, named Ernie, Gertrude and Harry.
|
|
Prepare frequency distributions and plot histogram
: Plot histogram and prepare frequency/cumulative frequency distributions. Step 4: Produce a frequency polygon and a cumulative frequency polygon - Sort data to find maximum, minimum and calculate range.
|
|
Strategic recommendations for organization relation
: Then after you have developed the PPM, write a narrative explaining the criteria you made on your map and discussing your strategic recommendations for the organization relation to competitors.
|
|
What is two-dimensional gel electrophoresis
: Q 1) What is two-Dimensional gel electrophoresis? Mention any two applicationsQ 2) What is the plant Introduction? How is it beneficial to the agricultural sector?
|
|
Change the font of your name to times new roman
: Change the font of your name to Times New Roman, size 26 or 28. Change the job titles and responsibilities to those that you had at each job or that you made up.
|
|
Write a critical analysis for each case study
: Critical analysis needed for the below case studies. Write a critical analysis for each case study attached, Which means I need critical anaylsis for case study 1 and critical analysis for case study 2 seperately. Each can be 1 and a half pages e..
|