Reference no: EM131128955
Experiment 1a: Pipettor Calibration Check
Question:Are my electronic pipettors operational?
1. Select any 3 of the 5 electronic pipettors within your workstation.
2. Select 5 volume settings within the specified range on the pipettor. Measure those volumes of deionized water in a weigh boat and record the corresponding weight in your laboratory notebook. (Hint: A table would be appropriate for data collection.)
3. Use the density of water to correlate what the theoretical weight measurement should be.
4. Using Excel, graph the weight of water measured (y-axis) as a function of the volume setting on the pipettor (x-axis). Label the axes, include your R2 value and secure the data in your lab notebook BEFORE leaving class.
5. Note in your notebook whether your pipettors are operational or not.
Experiment 1b. Bradford Protein Concentration Assay
Questions:
• What is the concentration of the protein sample provided?
• What are the limits in which the protein concentration could be determined experimentally?
• How linear is the standard curve?
• How accurate is the standard curve?
The Beer-Lambert Law (A = εlc) can be useful in estimating the total concentration of a single protein in solution. However, the total protein concentration in the Beer-Lambert law is based on the absorbance of a single amino acid, tryptophan, at 280 nm. What if only some proteins in the mixture contain Trp?
Then, the measured absorbance would not be proportional to the actual concentration of proteins in the mixture. Instead, a better estimate of total protein concentration can be determined from the Bradford Protein Assay.
The Bradford Protein Assay is one of several colorimetric assays commonly used to determine total protein concentration in a pure sample or in a mixture. The method is based on the proportional binding of the dye Coomassie (present in the Bradford Protein Assay Reagent) to proteins. Within the linear range of the assay, the more protein present, the more Coomassie binds. Furthermore, as the protein concentration increases, the color of the test sample becomes more intensely blue.
Many absorption assays are endpoint assays - meaning some reactant is added lastly to each sample to stop the reaction. The Bradford Protein Assay is instead a continuous assay; the longer the incubation, the greater the net binding of Coomassie dye to any protein present in the sample and the higher the absorbance readings. Since the assay does not measure an absolute endpoint, the concentration of protein in the test sample must be deduced by comparison with a set of standard proteins of known concentration. The assumption is that the protein in the test sample will give an identical response to that of the standard protein at the same concentration.
Coomassie dye in the Bradford Protein Assay absorbs light at 595 nm. The protein concentration of a test sample is determined by comparison to that of a series of protein standards known to reproducibly exhibit a linear absorbance profile in this assay. Although different protein standards can be used, we have chosen the most widely used protein as our standard - Bovine Serum Albumin (BSA).
1. Prepare 200 µL of a 4-fold dilution of 2 mg/mL BSA.
Add ______ µL of 2 mg/mL BSA + ______ µL of dI water = 200 µL of ______ mg/mL BSA (working solution).
2. Mix thoroughly but gently. The working solution of BSA will be used for the remainder of this experiment. Note: If you are using BSA with a different initial concentration than 2 mg/mL, adjust the dilution as needed.
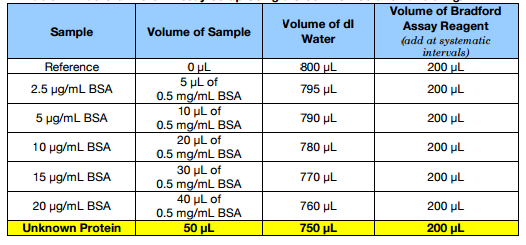
3. Generate samples according to Table 1 below in disposable cuvettes. Initially, mix only the protein and water in each cuvette.
4. Noting the time, add the Bradford Protein Assay reagent to each cuvette at the same pace with which you would read the absorbance measurements. For example, you should add Bradford Protein Assay Reagent to each cuvette in 30-sec intervals because you can measure and record absorbance data comfortably within 30-sec intervals. Use longer intervals, if necessary.
5. Note that a dilution of the "unknown protein" sample may be required for the resulting absorbance to fall within the linear range of the assay. Ask your TA or instructor for guidance on when to dilute your sample. In real experimental settings, you might have to determine the need for dilutions by trial and error.
Table 1. Bradford Protein Assay Setup Using a Stock BSA Solution at 0.5 mg/mL
6. Allow each sample to incubate at room temperature for a few (i.e. 2-10) minutes. (Record the actual incubation time in your notebook. Never allow the reaction to proceed for so long that the absorbance measurements grossly exceed 1.0.) Meanwhile, turn on your laptop and connect the SpectroVis Plus instrument to it via the USB connector.
7. Launch the LoggerPro software.
8. Select Experiment à Change Units à Spectrometer 1 à Absorbance
9. To calibrate the instrument:
a. Choose, Experiment à Calibrate à Spectrometer
b. Fill a cuvette about ¾ full with dI water
c. Place the water blank into the spectrometer
d. Follow the instructions in the dialog box to complete the calibration, then click OK.
10. Select the icon for Configure Spectrometer 1 Data Collection
a. Collection mode: Absorbance vs. concentration
b. Column Name: Concentration
c. Units: µg/mL
d. Single 10 nm band
e. Click 594.8 nm (for an estimate of 595 nm)
f. Click OK
11. Insert the sample into the SpectroVis Plus instrument.
12. For data collection:
a. Click Collect
b. Click Keep
c. Enter the concentration of the sample
d. Click Stop
e. Remove the sample
f. Insert another sample
g. At the appropriate time interval, click Collect
h. Select Append to Latest Data
i. Repeat until all data have been collected.
13. To save data, click File à Export As à CSV. Enter a file name and save the data in an appropriate directory.
14. Open the CSV file in EXCEL. To process the data:
a. Subtract the absorbance of the REFERENCE from each BSA standard curve data point.
b. Generate a scatter plot of the Absorbance at 595 nm (on the y-axis) as a function of the [BSA], µg/mL (on the x-axis).
c. Label the axes.
d. Remove excess horizontal lines
e. Determine the linear range of the data. Use only the linear range (use at least 5 points preferably) to deduce the equation of the linear fit.
f. Add the linear trendline fit, showing the equation and R2 value on the graph
g. Print the data and tape or glue it into your laboratory notebook.
h. Use the linear equation to compute the concentration of the protein unknown.
i. To assess the accuracy of the assay, put the absorbance data for each BSA standard back into the linear equation to compute the BSA concentration for each standard. Compare the computed BSA concentration to the theoretical concentration.
Experiment 1c. DNA Sample Concentration Determination
Question: What is the concentration of the unknown DNA sample?
1. Add 500 µL of the purified DNA solution to 500 µL of 50 mM Tris-HCl at pH 8 directly into a Plastibrand® cuvette, which is transparent to low range UV light.
2. Measure the absorbance of the DNA solution at 260 nm by following the steps below and record the absorbance in your lab notebook.
• Turn on the Shimadzu UV-1601 spectrometer
• Wait for all system checks to complete (usually in 5 min). If necessary, turn the instrument off and back on.
• Press MODE to see all measurement options.
• Select the PHOTOMETRIC mode (1).
• Make sure that data is shown in absorbance units rather than %T. If necessary press the appropriate function key (F1, F2, F3 or F4) to change the unit of measurement.
• Insert the reference and blank cuvettes into the instrument and close the sample chamber door.
• Press AUTOZERO and wait for a beep. The absorbance should be 0.0000.
• Remove the cuvette from the Sample (front) position.
• Cover the cuvette containing the DNA sample and mix with inversion.
• Insert the DNA sample into the instrument and close the sample chamber door.
• Record the absorbance reading.
• Remove all cuvettes and turn the instrument off.
3. As described by Sambrook and coworkers in the reference below, determine the concentration (in µg/mL) of the purified DNA sample as follows:
[DNA]original (µg/mL) = (A260) ? (50 µg/mL) ? (Dilution Factor)
Attachment:- bradford.xlsx