Reference no: EM13924186
Assignment 1: Signals & Spectra, Filtering, and Amplitude Modulation
Task 1: Fourier Series
Let fc > 0. Consider the half-wave-rectified cosine wave, a periodic signal defined as:
v(t) = Ac max(cos(2πfct), 0)
1. Sketch this signal. What is the period T0 of this signal?
2. Find the average value and the power of this signal by integrating 1/T0 v(t) and 1/T0 v2(t) respectively in the time domain, over one period. Your answer must be expressed in terms of fc and Ac only.
3. Derive and show that the Fourier coefficients of the above signal v(t) are given by:
(Ac/Π) . (-1)n/2 -1/n2-1 , n even
cn = Ac/4 , n = ± 1
0 , n odd and n ≠ ± 1
Hint:
sin ((n - 1))/2) π = (-1)n/2 -1 , n even
0 , n odd
4. Sketch the amplitude spectrum of this signal for the frequency range -7fc to 7fc.
5. Using Parseval's Theorem, write the power of the signal as an infinite series.
Now, write a script in MATLAB to perform the following. Use a time resolution of 128 samples per period. Plots of signals in the time domain must be for -10/fc ≤ t ≤ 10/fc. Plots of spectra must be for the frequency range -500 kHz to 500 kHz and must be "stem" plots:
6. Generate and plot the above signal, with Ac = 1 and fc = 150 kHz.
7. Plot the magnitude spectrum of the above signal, using the MATLAB ‘fft' function and other appropriate commands. How does the observation from your plot correspond with the plot you sketched in Question 4 above?
Task 2: Envelope Detection
Consider standard AM modulation, with the message signal x(t) of bandwidth W and satisfying |x(t)| < 1. This message signal modulates a carrier of amplitude Ac and frequency fc so that the modulated signal carrying the message is given by:
xc(t) = Ac(1 + µx(t). cos(2πfct).
8. Explain why xc (t) can be considered as a bandpass signal. Find the envelope A(t) and phase φ(t) of this bandpass signal, without assuming µ < 1.
9. Now assume µ < 1. Comment on the shape of the envelope and identify whether the envelope corresponds to the original message.
Assume an ideal envelope detector with the structure shown in the figure below:
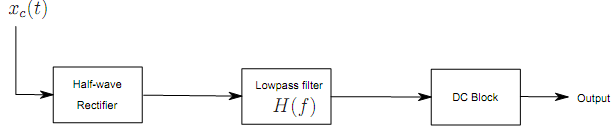
The input-output relationship for the half-wave rectifier stage is given by:
vout(t) = max.vin(t), 0.
10. Does this demodulator need carrier synchronization when µ < 1?
11. Assuming µ < 1, show that the output of the rectifier stage is given by:
x'c(t) = (1 + µx(t).v(t),
where v(t) is the half-wave-rectified cosine signal discussed in Task 1.
12. Using the Fourier series expansion for v(t) found in Task 1, show that the spectrum of x'c(t) is given by
X'c(f ) = ∞∑n=-∞ cn.δ(f - nfc) + µX(f - nfc),
where cn are the Fourier coefficients of v(t) and X(f ) is the spectrum of the message x(t).
Hint: Use the superposition and the complex modulation (frequency shift) properties of the Fourier transform.
13. Assume that the message signal is given by x(t) = sinc2(W t), where W << fc. Sketch the spectrum of the signal at the output of the rectifier stage for the frequency range -7fc to 7fc.
14. Using this spectrum, explain how the low pass filter in combination with the DC block recovers the message signal.
Use MATLAB to generate the following signals and spectra corresponding to the above envelope detector. Use a time resolution of 128 samples per period. All plots of signals in the time domain must be for -10/fc ≤ t ≤ 10/fc. All plots of spectra must be for the frequency range -500 kHz to 500 kHz and must be "stem plots":
15. Assume fc = 150 kHz, Ac = 1, µ = 0.75, and the message signal x(t) = sinc2(W t), with W = 40 kHz. Plot the modulated signal xc (t) and its spectrum.
16. Plot the signal at the output of the rectifier stage and the corresponding spectrum (am- plitude only).
17. Assume that the low-pass filter block in the above demodulator has the following transfer function:
H(f ) = 1/ 1 + j(f/f0)4
Plot the magnitude response of this filter in MATLAB for the following cases, using different colours in the same plot:
(a) f0 = 20 kHz
(b) f0 = 55 kHz
(c) f0 = 80 kHz
For each case, explain how the performance of the demodulator varies. Identify the case(s) that recover the best replica of the original message.
18. For each of the low-pass filters listed in the previous question, generate the plots of the signals and spectra (amplitude only) at the output of the low-pass filter. What do you observe, in each case?
Hint: To obtain the signal and spectrum after filtering, it is easy to operate in the frequency domain first. You first need to multiply the spectrum of the signal with the transfer function. This corresponds to convolution in the time domain. Plot the resulting spectrum, and then find and plot the time-domain signal by performing the inverse Fourier transform using the following two steps: (i) The IFFT shift operation and (ii) Taking IFFT. Remember to use the ‘real' function to discard any residual imaginary parts after the IFFT, which should not exist in theory, occurring due to numerical precision issues. Use the following MATLAB code segment as a guide:
N = length(t);
X_ft = fftshift(fft(x)); % The Fourier transform of the signal to be filtered
freq = linspace(-64/T_0,64/T_0,N); figure;
stem(freq,abs(X_ft)); % Spectrum of the signal to be filtered
f_0 = 20e3; % Filter parameters
m = 4;
X_filt = X_ft./(1+1i*(freq/f_0).^m); % Fourier transform of the filtered signal
figure;
stem(freq,abs(X_filt)); % Plot of the spectrum of the real signal
x_filt = real(ifft(ifftshift(X_filt))); % Inverse Fourier transform operation
figure;
plot(t,y_filt); % Plot of the filtered signal in time domainProblems
Assignment 2:
Sampling
1. Consider the sinusoidal signal
x(t) = 8 sin(6πt + ?0).
Assume ?0 = π/4 for this question and ?0 = 0 for the following two questions. Compute analytically the spectrum. Sketch the magnitude and phase spectrum.
What is the meaning of "Nyquist rate", and what is the Nyquist rate for this signal? (Consider the signal to be a low-pass signal.)
2. The sampling function
s(t) = +∞∑i=-∞ δ(t - iTs),
Ts = 1/4, is used to obtain the sampled signal y(t) = x(t).s(t).
Sketch y(t) alongside x(t) (at least 3 periods). Sketch the magnitude spectrum of y(t). Hint: Explicit computation of the spectrum Y (f ) is not required.
3. Assume now Ts = 1/16. The signal x(t) is reconstructed from the sampled signal y(t) using flat-top sampling, giving the reconstructed signal z(t).
Sketch z(t) alongside x(t) (at least three periods). Discuss if the original signal x(t) can be perfectly reconstructed from z(t).
Digital transmitter
4. Draw the block diagram of a digital transmitter.
Explain how the transmit signal is generated from the data bits to be transmitted.
5. Determine a symbol alphabet A4 for 4ASK and a symbol alphabet A8 for 8ASK, both such that the modulation symbols have uniform spacing and an average energy of Es = 1. Sketch the two signal constellations.
Assume two systems that employ these symbol alphabets and are identical otherwise. Compare the two systems with respect to transmit rate and probability of error.
Hint: Computation of the probability of error is not required, only a qualitative discussion.
6. Assume the symbol period Ts = 10 (in msec), and consider the transmit pulse
p(τ ) = 2 . sin πT/Ts for t ∈ [0, Ts],
0 otherwise.
With MATLAB, plot the pulse, and compute and plot its magnitude spectrum.
Discuss the time-domain and frequency-domain properties of this pulse with respect to its applicability in practice.
Hint: To compute the spectrum with sufficiently fine frequency resolution, consider a large enough time range, e.g. t ∈ [-10Ts, 10Ts].
7. Compute analytically the spectrum of the transmit pulse.
Plot this expression in MATLAB alongside the result from the previous question.
Hint: For the computation, you may express p(τ ) as the product of a sine wave and a rectangular pulse.
Digital receiver
8. Draw a block diagram of the receiver.
Explain how noise on the communication channel affects the signals in the receiver, and how it affects the symbol and bit estimates in the receiver.
9. Consider the transmit pulse p(τ ) from Equ. (1), and the receive filter
h(τ ) = rect (τ - (Ts/2)) / Ts
Consider transmission of the single modulation symbol x0 = +1 over a noise-free channel. Discuss whether the receive filter h(τ ) is optimal?
Plot the transmit signal, the receive signal and the signal at the receive-filter output with MATLAB. Indicate the optimal sample time, and explain why it is optimal.
10. Compute analytically the signal z(t) at the receive-filter output, assuming a noise-free channel.
Hint: The graphical representation of signal convolution helps to solve this problem.
11. Consider now transmission of a sequence of four modulation symbols from a 2ASK alphabet over a noise-free channel.
Plot in MATLAB the transmit signal and the output of the receive filter.
Discuss if there is intersymbol-interference (ISI) in this system. Explain ISI and how it can be avoided.
Decision regions
Consider a digital transmission system with the modulation alphabet A = {-5, -1, +1, +5} and an AWGN channel. Assume that transmit and receive filter are chosen such that we have zero ISI. Consider the samples of the matched-filter output (discrete-time signal model)
zk = xk + wk,
where zk ∈ A and wk is white Gaussian noise with zero mean and variance σ2 .
12. In "white Gaussian noise", what do the terms "white" and "Gaussian" mean?
With MATLAB, generate a long sequence of white Gaussian noise samples with zero mean and variance σ2 . Plot the relative frequencies (number of occurrence divided by number of samples) of the samples values.
Compute in MATLAB the mean and variance of the sequence.
Hint: Use the MATLAB functions randn and hist, and use enough bins with hist.
13. Sketch by hand the conditional probabilities (likelihoods) p(zk|xk) for the modulation symbols xk ∈ A.
Indicate the decision region for each symbol. Discuss which symbols you expect to experience high or low error rates.
14. Assume the decision regions from the previous question. For each modulation symbol xk ∈ A, give (a) an example of a noise value zk that leads to a correct decision, and (b) an example of a noise value zk that leads to an erroneous decision. Discuss your choices.