Reference no: EM131020750
Homework 6-
1. Suppose that GDP per capita is $20,000 in Xandu in 2013 and the yearly growth rate of GDP per capita in Xandu is constant and equal to 3.5%. In Yurdu, in contrast, the GDP per capita is $4,000 in 2013 and the yearly growth rate of GDP per capita in Yurdu is constant and equal to 7%. Assume that neither country experiences inflation in this problem.
a. Draw a time line that illustrates the level of GDP per capita in Xandu in 20 year increments for the next 100 years. Draw a time line that illustrates the level of GDP per capita in Yurdu in 10 year increments for the next 100 years. Given your analysis what can you say about the relationship between the level of GDP per capita in Xandu and Yurdu over the next century?
b. Xandu in 2013 has substantially higher GDP per capita than Yurdu. Will this always be the case? Explain your answer fully and completely.
c. Currently US GDP per capita is substantially higher than China's GDP per capita (2012 figures from the World Bank measured in 2012 U.S. dollars: $49,965 versus $6188) If these two countries GDP per capita grow at a constant and fixed annual rate of 2% and 5% per year, respectively, what will be the approximate number of years that will pass before the two countries have roughly equivalent GDP per capita? (Use the rule of 70 to get an approximate answer to this question.) Explain fully how you found your answer.
2. Suppose that you are told that a country's aggregate production function can be expressed as Y = 2K1/2L1/2. (Let me remind you that K1/2is the same as taking the square root of K; and L1/2is the same as taking the square root of L.) In this equation Y is real GDP, K is the units of capital, and L is the units of labor.
a. Using the above information fill in the following table:
|
Units of Capital
|
Units of Labor
|
Real GDP
|
|
100
|
0
|
|
|
100
|
1
|
|
|
100
|
4
|
|
|
100
|
9
|
|
|
100
|
16
|
|
b. Draw a graph of the relationship between the amount of labor, L, and the level of real GDP using the data from your table in (a). Measure labor on the x-axis and real GDP on the y-axis. Plot each point that you have in the table and then draw a smooth curve connecting these points to construct the aggregate production function for this country. Note this graph is a little different than the one we had in class: in class we had real GDP per unit of labor on the vertical axis (Y/L) and labor per unit of capital on the horizontal axis (L/K). The graph I want you to draw will be similar but will entail a lot less math. (You might find it fun to figure out how to do this with Excel!)
c. In your own words describe what happens to output as you increase the amount of labor hired in this economy while assuming that the level of capital is unchanged.
d. Now, suppose that the amount of capital increases to 144 units. Fill in the following table using this information.
|
Units of Capital
|
Units of Labor
|
Real GDP
|
|
144
|
0
|
|
|
|
1
|
|
|
|
4
|
|
|
|
9
|
|
|
|
16
|
|
e. Draw a new graph of the relationship between the amount of labor, L, and the level of real GDP using the data from your table in (a) and (d). Measure labor on the x-axis and real GDP on the y-axis. Plot each point that you have in the table and then draw a smooth curve connecting these points to construct the aggregate production function for this country. On this second graph you should end up with two lines depicting two different aggregate production functions for this economy: 1) the initial one when capital is equal to 100 units; and 2) the second one when capital is equal to 144 units. Label your new graph carefully and completely.
f. In your own words describe what happens to this economy when the amount of capital available increases from 100 units to 144 units for a given amount of labor. Is the amount of capital an economy has important? Explain your answer.
3. Describe in your own words what the term "leakages" mean when discussing the aggregate economy. In your explanation be sure to discuss the relationship between income, spending, and leakages.
4. Describe in your own words what the term "injections" mean when discussing the aggregate economy. In your explanation be sure to discuss the relationship between income, spending, injections, and leakages.
5. Consider the following graph depicting a long-run equilibrium in an economy using the aggregate demand-aggregate supply model.
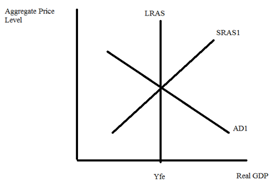
a. If you wanted to illustrate long-run economic growth using this model, how would you do that?
b. Go back to the original graph. Holding everything else constant, if the government increases government spending what will be the short-run impact on this economy of this change? What will be the long-run impact on this economy of this change? Use a graph as well as a verbal description to explain your answer.
c. Go back to the original graph. Holding everything else constant, if households decrease their spending (perhaps due to a real estate bubble bursting, or a stock market bubble bursting, or just because individuals feel less confident about how the economy is doing), what will be the short-run impact on this economy of this change? What will be the long-run impact on this economy of this change? Use a graph as well as a verbal description to explain your answer.
d. Given the analysis you have done in this problem, what policies might you suggest if the economy is in a recession? Explain how these policies would impact the economy using the framework provided by the aggregate demand-aggregate supply model.
6. Briefly describe three functions that money serves in an economy. You may find it helpful to consult your textbook or Wheelan for help on this one! Make sure you describe these functions: your answer should explain what each function means.
7. Wheelan discusses in Chapter 10 the idea that governments sometimes pursue inflationary policies. What kind of reasons does Wheelan provide for why a government might pursue this kind of policy? Use your own words to answer this question.
8. If the government increases its purchases by $100 billion, how will this shift the aggregate demand curve? Under what circumstances would it shift horizontally by exactly $100 billion, more than $100 billion, and less than $100 billion? Hint: this question is one that we may not fully cover in class, but it is a nice one for you to think about and ponder!