Describe the type of relationship that exists between the

Assignment Help Basic Statistics
Reference no: EM131091959

Question 1

Daily production of gadgets is normally distributed with mean 1000 (μ) and standard deviation 100 (o).

a) What is the probability that today's production will be more than 950?

b) If there are 22 working days in June, how many could be expected to have production being more than 950? (Give your answer to the nearest whole number.)

c) What is the probability that today's production will be between 950 and 1050?

d) The company has a policy that if daily production exceeds a certain level, X, all the workers will get a bonus. Assuming that the company does not want to give the workers a bonus more often that 5% of the time, what value should X have?

e) Find the interquartile range for daily production.

(Hint: It would be helpful if you draw the Z curve and shade the required region to see the required probability).

Question 2(A)

A survey of 20 randomly selected residents in the city of Hot Town found their mean annual income to be $39,580 with standard deviation $7,490.

a) Find a 95% confidence interval on the mean income for all residents in Hot

Town, stating clearly the formula you would use.

b) If it is now given that the population standard deviation is known to be $8,000, compute the 99% confidence interval using the same sample mean from part (a) above.

Question 2(B)

The supervisor of a Muesli Bar producing factory noted that the weight of each 30g bar is a normally distributed random variable with a mean of 30.25g and a standard deviation of 0.2g.

a) Find the probability that the mean weight of 5 Muesli bars is less than 30g?

b) Find the probability that the mean weight of 7 Muesli bars is less than 30g?

c) What can you conclude about the probability when the sample size increases? Use your answers to part (a) and (b).

Question 3

A study of the operation of a multi-storey car park in Chadstone plaza shows a historical mean parking time of 220 minutes per car. The car park area has been remodeled and the parking charges have increased. The manager believes that these changes have had an adverse effect on the mean parking time of the customers.

a) Specify the null and alternative hypotheses to test the manager's belief.

b) Is this a one tail or two tailed test?

c) If a sample of 40 cars yields a mean of 208 minutes and a standard deviation of

80 minutes, what conclusion can be drawn at 5% level of significance about the mean parking time by the customers? Show all relevant details and workings to support your conclusion.

d) Explain a type I error in the context of this problem.

Question 4

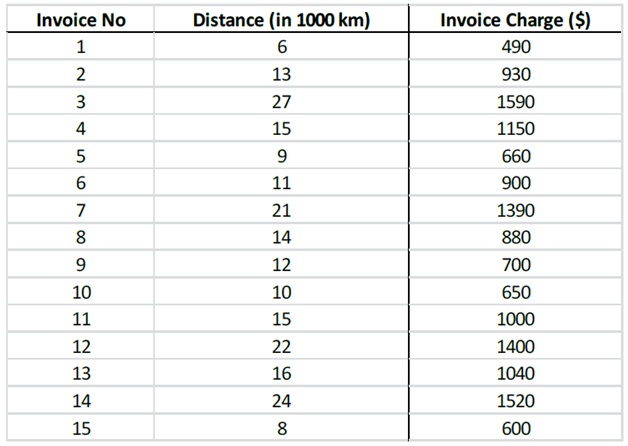
In a study of shipping costs incurred by a firm, a company controller has randomly selected 15 air freight invoices from current shippers in order to estimate the relationship between shipping costs and distance travelled for a given volume of goods. The results of this sample follow.

A summary output of the regression analysis of these data using Excel is given below.

593_2.jpg

2017_3.jpg

2166_4.jpg

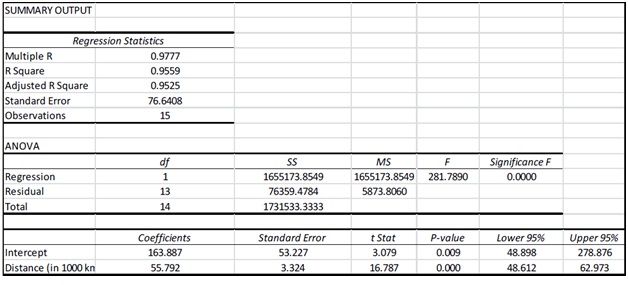
Answer the following questions based on the output above.

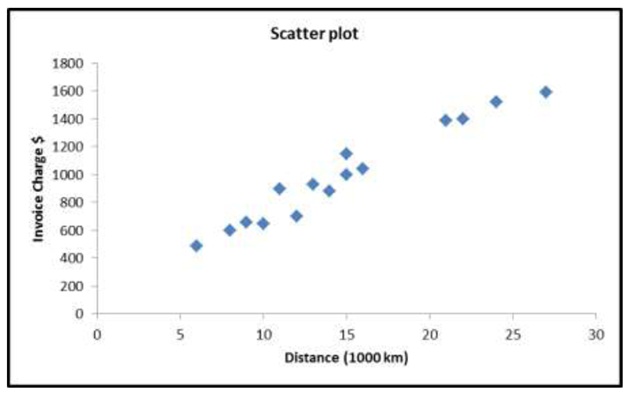
a) Describe the type of relationship that exists between the Invoice Charges and the Distance travelled.

b) Report the estimated linear regression equation that related Invoice charges to Distance travelled.

c) Interpret the slope coefficient of the regression line.

d) Interpret the intercept of the regression line.

e) Report the value of the coefficient of determination. What information is contained in this value?

f) On the basis of the given regression output, can we say that the linear relationship between Invoice Charges and the Distance travelled is statistically significant at 5% level of significance? Show all relevant details and use the p value approach to support your answer.

g) Predict the Invoice charge if the distance travelled is 2000 Km.

Question 5

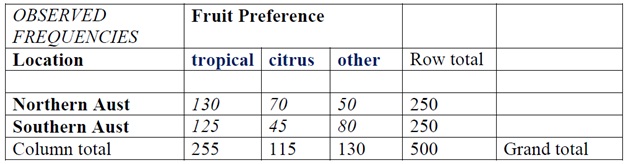
A survey of fruit preference of northern and southern Australians was carried out.

Researchers were interested to know whether Australians living in northern areas were more interested in tropical fruit because it was plentiful, as opposed to citrus and other fruit. A survey of 500 persons was carried out and the results are given below. Perform a χ2 test to see whether fruit preference and location in Australia are independent. Use a significance level of α= 0.05.

436_5.jpg

a. State the hypotheses that you are testing

b. Determine the critical value of χ2 and your decision rule

c. Calculate the χ2 test statistic for this data. (Show all workings)

d. State your decision and conclusion.

Reference no: EM131091959

Questions Cloud

Discuss the impact of financial innovations : Discuss the impact of financial innovations and financial regulation/deregulation in terms of affecting the workings of the macroeconomy, with special respect to risk taking. In order to make the analysis manageable, I suggest you focus on one par..
Describe the type of relationship that exists between the : Describe the type of relationship that exists between the Invoice Charges and the Distance travelled. Report the estimated linear regression equation that related Invoice charges to Distance travelled. Interpret the slope coefficient of the regressio..
Linear demand curve and constant marginal cost curve : Draw an example of a monopoly with a linear demand curve and a constant marginal cost curve.  Show the profit-maximizing price and output, p* and Q*, and identify the areas of consumer surplus, producer surplus, and deadweight loss. Also show the qua..
Calculate accounting ratios to assess the performance : Financial Reporting - Explain how the information needs of different user groups vary and prepare financial statements in a form suitable for publication by a sole trader, partnership and limited company
Describe the type of relationship that exists between the : Describe the type of relationship that exists between the Invoice Charges and the Distance travelled. Report the estimated linear regression equation that related Invoice charges to Distance travelled. Interpret the slope coefficient of the regressio..
How is it different from coupon rate or yield to maturity : What is the rate of return of any security? How is it different from the coupon rate or yield to maturity? Briefly describe the four types of credit market instruments. Provide one example of each type of instrument. What are the similarities and dif..
Compute the cum right price : XYZ Ltd has an issued share capital of 10 million ordinary shares with a par value of £1, on which it pays a constant dividend of £0.4 per share.  The market value per share was £2 ex-dividend.
Write a program to find the gross salary of given employee : Write a program to Find the gross salary of given employee.
Think discretionary fiscal policy : In the run up to the 2008 US presidential election, both major contenders, John McCain and Barack Obama, promised that if they were elected they would push for significant new discretionary fiscal policy in 2009. In your initial discussion post, do y..

Reviews

Write a Review


Basic Statistics Questions & Answers

  Assume the samples come from normal populations with equal

the manager of a computer software company is studying the number of hours too executives spend at their desktop

  Determine the least-squares regression equation

a. Determine the least-squares regression equation for y 5 total group revenue as a function of x1 5 num- ber of retail vehicles sold and x2 5 number of dealers in the group. Interpret each of the partial regression coefficients. b. At the 0.02 level..

  The us bureau of labor statistics produces consumer price

the u.s. bureau of labor statistics produces consumer price indexes for several different categories. shown here are

  A researcher wishes to test the effectiveness of a flu

a researcher wishes to test the effectiveness of a flu vaccination. 150 people are vaccinated 180 people are vaccinated

  Calculate the odds ratio associated with each age group

For each of the two groups, boys and girls, choose the lowest age group as the baseline and calculate the odds ratio associated with each age group.

  A regression of the amount of calories in a serving of

a regression of the amount of calories in a serving of breakfast cereal vs. the amount of fat in the cereal gave the

  T-tests and calculating right-tail p-value

The Web-based company Oh Baby! Gifts has a goal of processing 95 percent of its orders on the same day they are received. If 485 out of the next 500 orders are processed on the same day

  Clear heights of warehouses-normal distribution

Tompkins Associates reports that the mean clear height for a Class A warehouse in the Unites States is 22 feet. Suppose clear heights are normally distributed and that the standard deviation is 4 feet.

  Calculating your test statistic

Using a significance level of 0.05, perform a hypothesis test to see if the workers are right, and you need to hire more help. Write your hypotheses, calculate your test statistic and decide whether or not to reject your null.

  Poisson distribution-plausible model

Assuming that the Poisson distribution is a plausible model in describing variability of asbestos fiber counts in filters; derive a 95% confidence interval indicating the variability in the average number in asbestos fibers.

  The quality control team of this dairy company packaged

the freshness and overall quality of milk depend upon the type of packaging used. the manager of a dairy company is

  Calculate the measures of center and measures of variation

Calculate the measures of center and measures of variation

Free Assignment Quote

Assured A++ Grade

Get guaranteed satisfaction & time on delivery in every assignment order you paid with us! We ensure premium quality solution document along with free turntin report!

All rights reserved! Copyrights ©2019-2020 ExpertsMind IT Educational Pvt Ltd