Deployment issues for networked applications

Assignment Help Computer Networking
Reference no: EM132203135

Network Analysis using Wireshark

Purpose of the assessment (with ULO Mapping) This assignment is designed to develop deeper analytical understanding of different distributed network conditions.

At the completion of this assessment students should be able to:
d. Analyse performance and deployment issues for networked applications;
e. Compare appropriate industry tools and techniques to manage networked applications;

Assignment Description

The aim of the assignment is to develop an analytical understanding of performance and management of different types of networked applications. The assignment will provide an opportunity to understand network performance and management issues of networked applications using state of the art tools. These exercises provide an opportunity to demonstrate analytical ability of evaluating distributed systems performance, Quality of Service and service management.

Overview and General Instructions of Assignment

Students need to form a group of two in their own lab class and inform tutor about their group during Week 7 Lab. Each group will need to capture packets on their home network and at MIT while accessing the following websites. One website is of a news channel and the other one is a website for live streaming. The students are required to capture packets of multiple images from the news channel website and capture packets from the live stream website while streaming for 10 minutes once at MIT in a group and then on their home network individually. So at the end there will be six trace files, three for each website, two captured on MIT network and four on students' home networks.

Part 1:

The first part of the report should be about general statistics of all six captures using Wireshark that must include:

1. Time of capture
2. Total number of captured packets
3. IP addresses of the client and server

Part 2:

The second part of the report must include screen shots of packet capture, screenshots of different statistics from Wireshark and complete analysis of those screenshots for both websites for all three networks. Only screenshots of the graphs or other statistics will not get any marks as those must be analysed in detail to discuss the quality of service for a particular application. The students are required to analyse the network performance for the assigned websites considering following aspects:

1. Throughput
2. Round Trip Time
3. TCP retransmissions

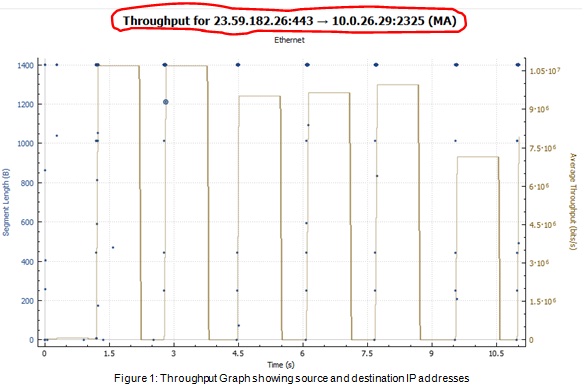
While collecting statistics please make sure, you are looking at the right flow as your Wireshark file may have packets from other applications and flows as well. Figure 1 on next page shows the throughput graph generated by Wireshark and source and destination addresses are clearly shown. You need to collect statistics for flows which are from server to client.

2028_figure.jpg

To see the TCP retransmissions you need to enter the following filter in Wireshark: tcp.analysis.retransmission

Part 3:

The third part of the report is about comparing the collected Wireshark statistics of the two different networked applications on three different networks. The throughput graphs and TCP retransmission statistics for web page transfer and live streaming (provided in part 2) need to be compared with each other and for all three networks. The differences of the performance to be identified and reasons must be provided for such differences.

Part 4:

Students need to download, install, use and compare another free network performance measurement tool from the Internet on their home computer. One possible option is Microsoft Message Analyzer. The tool should be used to analyse the network traffic captured while accessing one of the news websites mentioned in Table 1.

The chosen tool should be compared with Wireshark on the basis of following criteria:

1. Ease of access and use: how easy it is to download, install and start using (any changes to be made to the system etc.) as compared to Wireshark

2. GUI: Compare at least four GUI features of the chosen tool with Wireshark

3. Visualisation of traffic: After capturing packets by the chosen tool the effectiveness of the visualisation of the network traffic should be compared with Wireshark.

4. Statistics generation: At least one statistics like throughput, RTT etc. needs to be generated by the chosen tool and to be compared with the same generated by Wireshark.

Reference no: EM132203135

Questions Cloud

Determine the net income for the current fiscal year : Determine the net income for the current fiscal year (FY). Is this income up or down from the prior year? Determine the total value of assets
Pricing structure for the products you are selling : How would you research and decide upon your pricing structure for the products you are selling?
How the case moved through the lower courts : An explanation of the Supreme Court's involvement, including the following: How the case moved through the lower courts to eventually be heard by Supreme Court
Interpretation of the coefficient : Suppose a multiple regression model is given by y= 1.12x1 -6.14x2 -25.54. What would an interpretation of the coefficient of x1 be?
Deployment issues for networked applications : MN504 - Networked Application Management - Network Analysis using Wireshark - Analyse performance and deployment issues for networked applications
Compute the pearson correlation coefficient : Using the hypothetical data given in the following table, compute the Pearson correlation coefficient. (Round your answer to three decimal places.)
Find the equation if the regression line : Find the equation if the regression line for the given data. construct a scatter plot of the data and draw the regression line, then use
What is the probability that a randomly selected : 1. What is the probability that a randomly selected hockey stick will have a length of at least 193 cm?
Data on education level by gender : A recent market study produced the following data on education level by gender:

Reviews

len2203135

12/27/2018 2:22:16 AM

Conclusion /3 Logic is clear and easy to follow with strong arguments Consistency logical and convincing Mostly consistent logical and convincing Adequate cohesion and conviction Argument is confused and disjointed Reference style /2 Clear styles with excellent source of references. Clear referencing style Generally good referencing style Sometimes clear referencing style Lacks consistency with many errors

len2203135

12/27/2018 2:22:08 AM

Network Performance /15 All required matters are analysed in detail and exceptionally well, All screen shots are clear and complete Most of the required matters are analysed in detail , All screen shots are clear and complete Some required matters are analysed in detail and , Some screen shots are clear and complete Few of the required matters are analysed Not related or/and incomplete Comparison 1 /15 In detail comparison is provided and justification is given exceptionally well Some comparison is provided and justification given Some comparison is provided and incomplete justification is there Comparison and justification is incomplete Not related and/or incomplete Comparison 2 /12 In detail comparison is provided and justification is given exceptionally well Some comparison is provided and justification given Some comparison is provided and incomplete justification is there Comparison and justification is incomplete Not related and/or incomplete

len2203135

12/27/2018 2:22:00 AM

Marking Rubric for Assignment #1: Total Marks 60 Grade Mark HD > 80% DI 70-79% CR 60-69% P 50-59% Fail < 50% Excellent Very Good Good Satisfactory Unsatisfactory Introduction /4 Clear and concise outline is provided, report structure is described properly Clear outline is provided, report structure is described. Some outline is provided, report structure is somewhat discussed Some outline is provided,. This is no relevance to the assignment topic. General Statistics /9 All required aspects are discussed exceptionally well All required aspects are discussed Some aspects are discussed Very few aspects are discussed Not related

len2203135

12/27/2018 2:21:53 AM

Comparison 1 Comparison of the throughput and TCP retransmissions of both applications on three networks and discussion of the reasons for the difference. 5 * 3 = 15 Comparison 2 Comparison of the chosen tool with Wireshark in terms of: 1. Ease of access and use 2. GUI 3. Visualisation of traffic 4. Statistics generation The screenshots for both tools should be provided 3 * 4 = 12 Conclusion Complete summary of the report specially the comparison. 3 Reference style Follow IEEE reference style. 2 Total 60

len2203135

12/27/2018 2:21:46 AM

The comparison must include screenshots for both tools (your chosen tool and Wireshark) to judge the validity of the comparison. Marking criteria: Section to be included in the report Description of the section Marks Introduction Outline of the assignment Overall structure of the report 4 General Statistics For each capture following should be discussed: 1. Time of capture 2. Total number of captured packets 3. IP addresses of client and server 9 Network Performance Screenshots and analysis of the following: 1. Throughput 2. Round Trip Time 3. TCP retransmissions 5 * 3 = 15

len2203135

12/27/2018 2:21:34 AM

Submission Guidelines • All work must be submitted on Moodle by the due date along with a title Page. • The assignment must be in MS Word format, 1.5 spacing, 11-pt Calibri (Body) font and 2.54 cm margins on all four sides of your page with appropriate section headings. • Reference sources must be cited in the text of the report, and listed appropriately at the end in a reference list using IEEE referencing style.

Write a Review

Computer Networking Questions & Answers

  Provide network addresses which satisfy constraints

Subnet 1 is needed to support up to 125 Interfaces, and Subnet 2 and 3 are each needed to support up to 60 interfaces. Give three network addresses which satisfy these constraints.

  What is bandwidth required-synchronous time division

What is bandwidth required (in bps) if synchronous time division multiplexing is used, along with standard analog-to-digital sampling rate, and each sample is converted into 8-bit value?

  Construct a finite-state machine

Construct a finite-state machine that complements each bit of the binary input string (read left to right).

  Long time to access a web server

Explain why it may take long time to access a web server located in your own hometown, even when neither the server nor the Internet connection is a bottleneck.

  Implement the random midpoint displacement algorithm

Implement the random midpoint displacement algorithm in 3D and generate some fractal landscapes. Study the influence of H on the landscapes generated.

  The relationship between client/server model

the relationship between each terminal and the corresponding data center as either client/server or peer-to-pee.What transport protocols are used in the following applications? two data centers used for retail credit authorization are located in two ..

  Define the security strategies of defense

In this paper, you will define the security strategies of Defense in Depth and Layered Security along with comparing and contrasting the strategies by explaining, at least, two advantages and disadvantages of implementing each security strategy

  Network design

Imagine that you have been hired as a contractor by a local business that has recently purchased new office space for its growing business. Design a network for the local business based on the following information: The business has approximately ..

  WLAN Design Project - Small to Medium Enterprise

NIT6110 Advanced Wireless Networks Assignment, VICTORIA UNIVERSITY, AUSTRALIA. WLAN Design Project - Small to Medium Enterprise

  Discuss best practices for the system/application domain

Discuss best practices for the system/application domain, APA format with references

  Question 1 let npq where pq are primes of the same length

question 1 let npq where pq are primes of the same length and let phi be eulers totient function. consider the

  List three practical functions of the osi model

List three practical functions of the OSI model. List the seven layers of the OSI model, including both layer number and name for each. Describe the three modes of communication available on a network.

Free Assignment Quote

Assured A++ Grade

Get guaranteed satisfaction & time on delivery in every assignment order you paid with us! We ensure premium quality solution document along with free turntin report!

All rights reserved! Copyrights ©2019-2020 ExpertsMind IT Educational Pvt Ltd