Reference no: EM131034551
Problem 1: What-if and Goal-seeking analysis
George is planning to set up a new hair salon in a trendy inner city Melbourne suburb. George estimates that his fixed annual costs (which include rent, loan interest, electricity expenses, etc.) will be $150,000. He is planning on employing a total of five hair stylists, who will each work 1,600 hours per year. He plans to charge a fixed price for haircuts ($35 for men, $60 for women), and estimates that 65% of his customers will be women. He is having difficulty determining the pay structure for the hair stylists, and is considering the following three possibilities:
Scenario 1: Fixed hourly rate of $40 per hour.
Scenario 2: Fixed hourly rate of $20 per hour + a commission on each haircut of 20% of the cost of the haircut.
Scenario 3: No fixed hourly rate, but a commission on each haircut of 30% of the cost of the haircut.
George would like to know the following:
- Under each of the above scenarios, what would be the break-even point in the number of haircuts; i.e., how many haircuts must the salon deliver in order to just cover total costs?
- In Scenario 2 (i.e., fixed hourly rate + commission), assuming the salon would deliver a total of 5,000 hairstyles for the year, what would the commission need to be in order for the total costs to be the same as per Scenario 1?
Create an Excel spreadsheet that George can use as a decision support tool to answer his questions. The spreadsheet should be designed such that George would be able to use the spreadsheet without any additional documentation.
What to submit: A written report that describes how you solved the problem, and the information that George requires. The report should contain screen shots of the spreadsheet that you constructed to solve the problem: one screen shot showing the spreadsheet without formulas showing, and another showing the spreadsheet formulas (see Appendix B for directions on how to display formulas in Excel). Make sure that your report shows how you used your spreadsheet to perform the goal- seeking. The screen shots should include row and column headers.
Problem 2: Decision analysis using decision tables
Maddy and Alex are old school friends, and are now undertaking undergraduate degrees in business and IT respectively. In an attempt to make some extra money, they are thinking of setting up a tutoring agency, through which they will provide tutoring services to students in their last two years of secondary schooling. If their plan goes ahead, they will need to rent some office space in order to deliver these services.
They have identified three strategies. Strategy 1 is to rent a fairly expensive office in a location in close proximity to many schools. They estimate that in a favourable market, they would be able to obtain a net profit of $10,000 over two years; but if the market was unfavourable, they could lose $8,000. Strategy 2 is to rent a more modest office space. Under a favourable market they could get a return of $8,000, but in an unfavourable market would lose $4,000. They estimate that there is a 50% chance that the market is favourable, and therefore a 50% chance that it is unfavourable. The third strategy is to do nothing; i.e., not set up the business. Maddy and Alex have very different approaches when it comes to risk. Whereas Maddy has an optimistic predisposition and likes to take risks, Alex always tries to avoid risk.
Provide answers, with justifications, for each of the following questions:
a. What would Maddy's decision be? Why?
b. What would Alex's decision be? Why?
c. What would their decision be if they were to choose the alternative with the greatest expected value? Show all calculations, and justify your answer.
Maddy and Alex now believe that the probability of a favourable market is not 50%.
d. Construct a plot showing how the expected value of the returns for Strategy 1 and Strategy 2 vary with the value of P (for 0 ≤ P ≤ 1), where P is the probability of a favourable market.
e. Find the range of values for P for which the following decisions would be made
i. Strategy 1
ii. Strategy 2
iii. Strategy 3
What to submit: A written report which contains: (i) the decision tables that you used to solve the problem; (ii) clear answers, with justification, to each of the questions; (iii) plots for (d); and (iv) your answers for (e), making sure that it is clear as to how you arrived at these answers.
Problem 3: Optimizing an advertising program
Fred Dainty is the marketing director for the Bet Big sports betting agency, and is considering how to advertise the company so as to attract as many new customers as possible. Fred has been given a budget of up to $15,000 per week to be spent on advertising. The money is to be spent over four types of adds: television ads, radio ads, billboard ads and newspaper ads.
- TV ads cost $800 per ad, and each ad reaches an estimated audience of 30,000 viewers. The maximum number of TV ads that can be placed per week is 10.
- Radio ads cost $400 per ad, and each ad reaches an estimated audience of 22,000 viewers. The maximum number of radio ads that can be placed per week is 10.
- Billboard ads cost $500 per ad, and each ad reaches an estimated audience of 24,000 viewers. The maximum number of billboards ads that can be placed per week is 10.
- Newspaper ads cost $100 per ad, and each ad reaches an estimated audience of 8,000 viewers. The maximum number of newspaper ads that can be placed per week is 10.
Bet Big has a number of contractual arrangements, one which requires that it places at least six ads per week on TV or radio or some combination of the two. Bet Big's management also require that the amount spent on billboards and newspapers together must not exceed the amount spend on TV ads.
Fred needs to know how many ads of each type should be placed in order to maximise the total number of people reached.
Your task is to set this problem up as a linear programming problem, and solve it in Excel using the Solver linear programming add-on for Excel.
What to submit: A written report that describes how the problem was set up of as a linear programming problem. The report should contain screen shots of the spreadsheet that you constructed to solve the problem (one screen shot showing the spreadsheet before the optimization, and another showing the spreadsheet after the optimization). These screen shots should include row and column headers. The report should also include a screen shot of the Solver dialog box showing how you performed the optimization.
Problem 4: Simulating inventory level
Joe is the owner of a hardware store. Amongst the many items he sells are lawnmowers. He has just started selling a new model of lawnmower - the Green101, which has proved to be popular with his customers, even though it is relatively expensive. A problem for Joe is that there is often insufficient quantity of the mowers in stock, and means that customers must wait until he can have some new stock delivered. Even worse, some customers may not wish to wait for an order to come through, and purchase the mower from one of Joe's competitors. Also, Joe is severely short of storeroom space, so he cannot afford to have too many of the mowers in stock. He would like to develop an inventory policy for the Green101.
The problem contains a number of probabilistic variables, and thus Joe would like to set up a simulation model to help him explore a number of possibilities.
Daily demand for the Super101 is subject to variability, and is thus a probabilistic variable. Table I shows the daily demand for the Super101 over the past 300 days. From this table, Joe can estimate, for example, that the probability of selling exactly two units of the Green 101 on any particular day is 0.20.
Table I: Demand and frequency for Super101
|
Demand
|
0
|
1
|
2
|
3
|
4
|
5
|
|
Frequency (days)
|
15
|
30
|
60
|
120
|
45
|
30
|
When Joe places an order to replenish his inventory of the Green101, it can take anywhere between 1 and 3 days for the stock to be delivered to his store; i.e., there is a 1 to 3 day lead time. Thus, lead time can also be considered a probabilistic variable. If the lead time for the order is 1 day, the order will not arrive the next morning, but at the beginning of the following working day. For example, assuming an order is placed on a Monday, if the lead time is 1 day the stock will arrive on the Wednesday, if the lead time is 2 days then the stock will arrive on the Thursday, and so on. Table II shows the lead time for the last 50 orders that Joe has placed. From this table, Joe can estimate, for example, that the probability of receiving new stock exactly two days after an has been ordered is 0.50.
Table II: Lead time and frequency for Super101 orders
|
Lead time
|
0
|
1
|
2
|
|
Frequency (orders)
|
10
|
25
|
15
|
Joe is considering the following inventory policy. Whenever the day's ending inventory reaches the re-order point of 5 units and there are no outstanding orders which have not yet arrived, Joe requests an additional 10 units from his supplier (i.e., the re-order quantity is 10). A 6-day snippet of the simulation is shown in Table III.
Table III: Simulation of Super101 inventory for 6 days
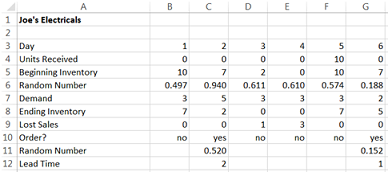
Here is an explanation of the simulation in the above table. It is assumed that the beginning inventory is 10 units. Since the demand on day 1 is 3 units, the ending inventory on day 1 is 7. This is above the re-order point of 5 units, so no order is placed on day 1. Since the demand on day 2 is 5 units, the ending inventory will be 2 units, and thus an order for 10 units will be placed. The lead time for the order is 2, which means that the 10 ordered units will not be received until day 5. There is a lost sale of 1 unit on day 3 because the demand on day 3 is 3 units, but the beginning inventory is only 2 units. Similarly, there are lost sales on day 4. Note that although the ending inventory on days 3 and 4 is below the re-order level, no orders are placed on these days because there is an outstanding order from day 2 which has not yet arrived.
There are various costs associated with the inventory policy. The cost of placing an order is $35 (this is a fixed cost and does not depend on the number of items in the order). The cost of holding a Green 101 in stock is $2,000 per mower per year (or $10 per day, over a 200-day year). Joe estimates that the cost of each lost sale is $150. Joe can easily calculate these costs from the spreadsheet above. For example, it can be seen that over the 6 days, 2 orders have been placed (2 x $35 = $70); 21 mowers have been held in stock (21 x $10 = $410); and there have been 4 lost sales (4 x $150 = $600). The cost over the 6 days is thus $1080.
(a) Joe would like to know the yearly cost of this inventory policy.
Implement the policy using a spreadsheet, run a 200-day simulation (Joe's store is open for 200 days a year), and estimate the yearly inventory cost. Note that you will probably observe considerable variability between different simulation trials. A solution to this is to run several trials (say, 10), and to calculate the average yearly inventory cost.
(b) Joe would like to experiment with some other values for re-order point and re-order quantity.
Complete the table below with the estimated cost corresponding to each combination of values for re-order point and re-order quantity. Once again, each of these should be the average over a sufficient number of trials. (NOTE: In order to avoid having to make many changes to your formulas, it will be much easier if you design your spreadsheet in such a way that re-order point and re-order quantity are accessed from cells containing these values; that is, you should be able to simply change the value in the cells containing these parameter values, and instantly see the results of the new simulation).
|
|
Re-order point
|
|
5
|
10
|
15
|
|
Re-order quantity
|
5
|
|
|
|
|
10
|
|
|
|
|
15
|
|
|
|
What to submit: A report that includes: (i) a screen shot of your spreadsheet showing the first 15 days of your simulation for (a); and (ii) your calculations for the total inventory cost in (a), and the completed table for (b).
Problem 5: Mining a Bank Marketing dataset
You have just started working at a bank, and your boss has recently become interested in data mining, and particularly the opportunities that it might provide for direct marketing of some new investment products that his bank has created. Your boss knows that you have taken a course in decision support systems that included a component on data mining, and he would like you to provide him with some information on data mining and its use in direct marketing. He has referred you to the following paper, which he recently became aware of, but, given his lack of background knowledge in this area, finds difficult to understand: "Using Data Mining for Bank Direct Marketing: An Application of the CRISP-DM Methodology", by Moro, Laureano and Cortez (2011). He would like you to access the datasets used in this paper, apply a number of data mining algorithms to this data, and to write a report on your investigation and findings.
(a) Obtaining the datasets
The datasets used in the paper by Moro et al can be found in the file bank.zip, which you will find at the URL: https://archive.ics.uci.edu/ml/datasets/Bank+Marketing. Note that the file bank.zip contains a number of files:
- bank-names.txt, which contains, amongst other information, a description of the fields contained in the dataset;
- bank-full.csv, which is the full dataset, containing 45,212 examples, and
- bank.csv, which is the reduced dataset, containing 4,521 examples (10% of the samples in the full dataset).
For this exercise, you are to use the reduced dataset bank.csv. Note, however, that even though this file contains the extension '.csv', it is not, in fact, a comma-separated file. You will need to do some pre-processing before you will be able to open this in WEKA. It is suggested that you open the file in a text editor that has find-and-replace capabilities, and replace the semicolon characters (i.e., ';') with commas (i.e., ','). You will probably also need to remove the quotation marks.
(b) Preliminary questions
Answer the following questions:
i. How many features or attributes does the data contain?
ii. How many examples does the data contain?
iii. What is the name of the attribute that describes the class variable?
iv. How many possible values can the class variable take?
v. How many examples are affiliated with each of the classes?
(c) Experiments
After pre-processing the dataset appropriately, use the WEKA data mining toolkit to apply each of the following classifiers to it:
- J48 (this is the WEKA version of Quinlan's C4.5)
- Logistic Regression
- Naïve Bayes
Remember that we are mainly interested in the capability of the classifier to correctly predict the class of examples which have not been used in model construction, so you will have to choose your test options carefully.
(d) Results
Present the following results for each of the three classifiers:
i. The confusion matrix using the format below (note that WEKA may present this differently):
|
True Class |
| Positive |
Negative |
| Predicted Class |
Positive |
(TP) |
(FP) |
| Negative |
(FN) |
(TN) |
ii. The accuracy measure
iii. The precision measure
iv. The recall measure
(e) Conclusions
i. Which of accuracy, precision or recall do you think is the more important measure of performance for this problem? Why?
ii. Recommend one of the three classifiers for this problem. Justify your answer.
Reference:
S. Moro, R. Laureano and P. Cortez. "Using Data Mining for Bank Direct Marketing: An Application of the CRISP-DM Methodology", in P. Novais et al. (Eds.), Proceedings of the European Simulation and Modelling Conference - ESM'2011, pp. 117-121, Guimarães, Portugal, October, 2011. EUROSIS. (available from the following URL: https://repositorium.sdum.uminho.pt/bitstream/1822/14838/1/MoroCortezLaureano_DMApproa ch4DirectMKT.pdf
What to submit: A written report that contains: (i) your answers to the preliminary questions; (ii) a description of how you ran your experiments (Did you use a train/test split? Or did you use cross-validation? Why? How did you decide on how many folds to use?); (iii) your results for each of the three classifiers; (iv) your conclusions.