Reference no: EM131108866
MAKE SURE TO REPORT ALL YOUR RESULTS IN PLAIN WORDS AS WELL AS MATHEMATICAL TERMS. ALSO TURN IN YOUR STATA LOG FILE FOR THIS PROBLEM SET
Exercise I. Impact analysis of E-ZPass on pollution by double difference
In this exercise, we will consider pan of a policy analysis that was published in the American Economic Journal: Applied Economics in 2011 ("Traffic Congestion and Infant Health: Evidence from E-ZPass" by Janet Currie and Reed Walker, Vol. 3, No. I, pp. 65-90). The paper examines the effect of the introduction of E-ZPass in New Jersey and Pennsylvania on infant health. E-ZPass is an automated system that allows users of toll roads to pass through tollgates by paying electronically through a radio device. This system is similar to Fastrak in the Bay Area. The basic intuition is that E-ZPass reduces the time can are in the queue to pay tolls and thus reduces air pollution in the nearby area. The hypothesis is that this in turn improves health of infants born to mothers residing near the toll plazas. In this exercise we will consider the intermediate result in the paper of whether the introduction of E-ZPass reduces air pollution.
We have uploaded on the course website a dataset (carpollution.dta) with 743 observations. The unit of observation is a monthly average reading at a pollution monitor. In this exercise we will consider monitors to be "treated" if they are within 4 km of a tollbooth that was convened to E•ZPass. We will consider monitors as "control" if they are from 4-10 km of a tollbooth.
monitor:CD •1D of pollution monitor
month2 •Month of reading (numeric)
year2 -Year of reading (numeric)
logno2 .Log of daily mean NO2
logso2 -Log of daily mean SO2
treat •1 if monitor < 4km from nearest tollbooth, 0 if 4-10 km
after •1 if reading after nearest toll plaza converted to E-ZPass
(a) Compute the mean log NO2 concentration for treated monitors before and after the nearest toll plan was converted to E-ZPass. Is there a statistically significant change in NO2 levels? Repeat for monitors that ware from 4-10 km from the nearest tollbooth.
State Tip: Here it's necessary to do t•tests comparing duration of benefits between two groups (before and after) but only for the "treated" monitors or only for the "control" monitors. The command for this kind of •em is ttest -carl if vaz2••n, by (groupvaz ) where vac: is the variable for which you're comparing means, groupvar is the variable that categorizes the two groups to be compared (i.e. before/after), and vaz2••n should be set to limit the set of monitors being compared (i.e. limiting to treatment monitors only or control monitors only, so you'll need to think of what to change var2 to be as well as what to change n to be for each of the two tests).
(b)Write an equation that will give you the Difference-in•Differences estimator for the impact of EZPass on pollution levels. Give a verbal interpretation of the estimator. Perform the estimation for NO2.What do von enneltule?Exercise 2. Measuring the effect of climate change on U.S. agriculture with panel data
In this exercise, we will use data from a paper that was published in the American Economic Review in 2007 ("The Economic Impacts of Climate Change: Evidence from Agricultural Output and Random Fluctuations in Weather" by Olivia Deschenes and Michael Greenstone, Vol. 97, No. I, pp. 354-385). The basic goal of the paper is to assess the effect of changes in temperature and precipitation on profitability of US agriculture using county level panel data.
In this exercise we will run some basic regressions to replicate the main point of the paper. I have uploaded a dame (agclimate.dta) with 1,067 observations over four years: 1987, 1992, 1997, and 2002. These data some from the US Agricultural Census. I have limited the data to dry land farming (w/out irrigation). The data contain the following variables:
figs county identifier
agprof it real agricultural profit in S/acre
ddB9 temperature in growing degree-days (April-September)
prep total precipitation in growing season (inches)
year year
Note that growing degree-days are a common measure of temperature used in agronomic studies. Deschenes and Greenstone explain. "the degree-days variable is calculated so that a day with a mean temperature below 46.4°F contributes 0 degree-days; between 46.4°F and 89.6°F contributes the number of degrees above 46.4 degree-days: above 89.6°F contributes 43.2 degree-days (p.361-362)."
(a) Briefly describe the data that you have in a short paragraph: How many counties? Which years? Give brief summary statistics on the variable measuring agricultural profits and on the climate variables.
(b) Create year dummy variables and estimate the following equation for agricultural profits: (I) agpro" fin - 64y92, +6207,-6002,+ab
What is the meaning of the different 6's? Why is the 1987 dummy variable excluded?
State tip: To take a variable (called x) and turn it into several dummy variables (called yl...yn, one for each possible value of the variable), use the command tabulate x, gen (y) . Then look at the list of variables in State to make sure that you see it worked.
(e) Consider now the following (unobserved) fixed effects model:
(2) agprofitt¦ A + 62392, +62y97,+60112,+ A dd890132 prp, a, -9E1
Whet ie the intterrtrethetint of the fireel effetete tonne n, Whit era t.e seltlina these AnA Aisne ha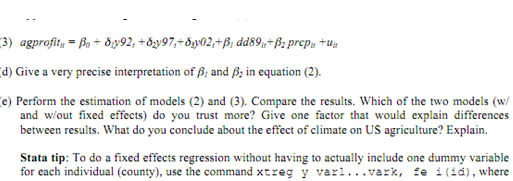
you change y to be the dependent variable, va................ "ark to be the independent variables
except for the as's, and id to be the variable that indexes the individuals.
(I) What are the assumptions necessary for the parameters of model (2) to be unbiased? Do you think they are likely to hold? Whatever position you take. give your argument.
Exercise 3. Health effect of air pollution
Suppose you collect data on age, gender. mother's education, and health indicators of school age children (6 to 15 years old). One health indicator is the number of days the child has missed school due to asthma related problems. In addition, you collect data on air quality (units of solid particle per volume of air) in the neighborhood they live. The issue that we want to study is the effect of air pollution on asthma.
a. Write an equation that would allow you to estimate the effects of air pollution on asthma, while controlling for other factors. You should be able to make statements such as "An increase of the pollution index by 10 units is estimated to increase health related absence from school by
b. Write an model that would allow you to test whether pollution has different effects for younger children (10 and less) and older children (11.15 years old). How would you test that there arc no difference in the effect of pollution on these two groups of children.
c. Suppose now that the data on air quality comes in a qualitative way: very•high, high, moderate, low. Now write a model that allows you to estimate the effect of air pollution on children's asthma.
d. Using the model in question c, explain in details how to test the null hypothesis that air pollution has no effect on health. Be very specific and include a careful listing of degrees of freedom.
e. What are some potential problems with drawing causal inference using the survey data you collected?