Reference no: EM131316351
ROMERO
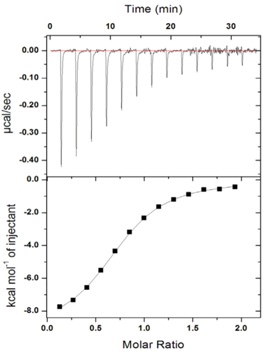
This figure represents an isothermal titration calorimetry experiment. Protein X and ligand Y interact inside a calorimeter chamber. The experiment is done like this:
- 200 μl of a 2 μM solution of protein X is placed inside the calorimeter chamber.
- A titration syringe is loaded with a solution containing Y (60 μM).
- At each point in time, as shown in the upper panel, 1 μl of the Y solution is injected into the calorimeter chamber. This injection results in the release of heat, as shown in the upper graph. The amount of heat being releasedchanges with each injectionbecause the binding sites are being saturated and there are fewer available sites to bind the ligand.
- Thus, the number of mols of X in the chamber remains constant, whereas the number of mols of Y increases with every injection.
- The experiment was done at 25 °C
The heat released can be measured by the area of each one of the peaks shown in the upper panel. Calorimeters come with software that does this automatically for you and generate curves like that shown in the lower panel. The software corrects for the small dilution of X in the chamber (after 13 injections the volume has increased from 200 to 213 μl assuming that nothing gets removed). Therefore, the Molar Ratio (mols of Y/mol of X in the chamber) is an accurate number. The analysis software extracts several parameters from these data: ?H, ?S, K (equilibrium constant), and some estimate of the stoichiometry of the reaction.
Your job is to replace the instrument's software with your understanding of the analysis methodology. In other words, you must calculate the thermodynamic numbers associated with this reaction. You can do this using Excel or a piece of software available for download from the University (Prism). Because you need to plug in some numbers, there is a piece of freeware that is very useful for the digitation of plots (Plotdigitizer: https://plotdigitizer.sourceforge.net). If you don't want to use Plotdigitizer, you can always extract the data using a ruler and measuring distances to the X and Y axes.
These are your tasks:
1. Transform the lower graph into a classical binding isotherm and plot Bound [Y] vs Free [Y] (or Bound [Y] vs log Free [Y]).
2. Calculate the equilibrium constant and the binding stoichiometry.
3. If the stoichiometry is not 1, please discuss your result.
4. Calculate the ?H and the ?S of the reaction. The SIGNS are important.
|
Forecast sales for next six months using forecasting method
: Forecast sales for the next six months using an appropriate forecasting method.- Plot a control chart. Are you able to detect any anomalies?
|
|
What are the pros/cons of a high protein diet for athletes
: What are the protein requirements for Liz and Larry based upon the information provided and their athletic status?What are the pros/cons of a high protein diet for athletes?What advice would you give to Liz and Larry on whether they should follow a ..
|
|
Discuss the implication of the future of social media on hrm
: Discuss the unique relationship between the security professional and organizational ethics. Discuss the implications of the future of social media on HRM.
|
|
Who is most closely associated with the production era
: Who is MOST closely associated with the Production Era? Which of the following most accurately reflects the history of business in the US, from earliest to most recent?
|
|
Calculate equilibrium constant and binding stoichiometry
: Foundations of Biomedical Science Calculate the equilibrium constant and the binding stoichiometry and calculate the ?H and the ?S of the reaction. The SIGNS are important.
|
|
How is health promotion defined by the group
: Analyze the health status of a specific minority group. Select a minority group that is represented in the United States (examples include: American Indian/Alaskan Native, Asian American, Black or African American, Hispanic or Latino, Native Hawai..
|
|
Identify two reason why these groups are adopting this model
: One model of leadership being adopted by many organizations, disciplines, and vocations is servant leadership. Describe this model. Identify two reasons why these groups are adopting this model.
|
|
What is the value of p
: Describe how fixed costs fi, i ∈ V1, in the CPL model should be computed in order to take labour costs, property taxes and site developments costs into account.
|
|
Compute the number of payments required to pay off the loan
: Compute the number of payments required to pay off the loan. Note that the last payment may not be exactly $500.
|