Reference no: EM131036343
QUESTION 1. Dr. Mack Lemore, an expert in consumer behavior, wants to estimate the average amount of money that people spend in thrift shops. He takes a small sample of 8 individuals and asks them to report how much money they had in their pockets the last time they went shopping at a thrift store. Here are the data:
26, 18, 15, 13, 14, 24, 19, 17.
Find the upper bound of a 95% confidence interval for the true mean amount of money individuals carry with them to thrift stores, to two decimal places.
QUESTION 2 The senior partner at a large accounting firm is reviewing data on the time that his firm's accountants spend assisting clients with audits. In a random sample of 10 audit times, the average time in hours was 3.79 with a standard deviation of
0.7. Find the lower bound of a 90% confidence interval for the true mean amount of time the firm spends on an audit, to two decimal places.
QUESTION 3 Suppose you calculate a 95% confidence interval for the mean salary of accountants one year after obtaining their MBAs to be $64,000 to $89,000 per year. Which of the following statements is the correct interpretation of this interval? Read carefully! e 95% of all accountants in the population one year after obtaining their MBAs earn between $64,000 to $89,000 per year, based on the method used to construct the interval.
Q-) We are 95% confident, based on the method used to construct the interval, that the true mean salary of accountants one year after obtaining their MBAs is between $64,000 and $89,000 per year.
We are confident that 95% of the accountants in our sample earned between $64,000 and $89,000 per year.
We are 95% confident, based on the method used to construct the interval, that any given accountant one year after obtaining an MBA will earn between $64,000 and $89,000 per year.
There is a 95% chance that this particular interval, $64,000 to $89,000 per year, contains the true mean salary of accountants one year after obtaining their MBAs.
QUESTION 4 A random sample of 51 undergraduate statistics students resulted in a sample mean age of 22.1 years, with a sample standard deviation of 2.9 years. Find the upper bound of the 99% confidence interval for the true mean age, to one decimal place.
QUESTION 5 A random sample of 51 undergraduate statistics students resulted in a sample mean age of 22.8 years, with a sample standard deviation of 3.5 years. Find the lower bound of the 90% confidence interval for the true mean age, to one decimal place.
QUESTION 6 Suppose you gather a random sample size 264 customers who accepted a balance transfer offer from a credit card company three months ago. The company wants to determine if it should expand the offer to a larger population. The sample mean balance transfer amount is 1,584 with a sample standard deviation of 416.
Based on the information above, if the company were to perform a hypothesis test at alpha = 0.05, what is the largest value it could specify in the null hypothesis and still fail to reject?:
Hint: What is the relationship between a test done at CY = 0.05 and a 95% confidence interval?
QUESTION 7 A researcher wants to study sports-watching behavior of young men. In a random sample of 18 young adult men 20-30 years old, each person was asked how many minutes of sports he watched on TV daily. The researcher wishes to test whether the mean amount of television watched daily by young men is greater than 50 minutes.
Which of the following is the correct specification of the alternative hypothesis?
[Note: If you cannot see the answer choices below, you need to download and/or enable Java in your browser. Go to www.java.com to learn how to do this].
QUESTION 8 A researcher wants to study sports-watching behavior of young men. In a random sample of 18 young adult men 20-30 years old, each person was asked how many minutes of sports he watched on TV daily. The researcher wishes to test whether the mean amount of television watched daily by young men is greater than 49 minutes.
Suppose the sample mean is 57.8 and the sample standard deviation is 5.7. Calculate the test statistic to two decimal places.
QUESTION 9 A researcher wants to study sports-watching behavior of young men. In a random sample of 18 young adult men 20-30 years old, each person was asked how many minutes of sports he watched on TV daily. The researcher wishes to test whether the mean amount of television watched daily by young men is greater than 50 minutes.
What would be a Type I error, in the context of this problem?
e> The researcher concludes that the mean amount of television watched by young men is less than or equal to 50, when the mean is really less than or equal to 50.
n The researcher fails to conclude that the mean amount of television watched by young men is greater than 50, when the mean is really greater than 50.
65 The researcher concludes that the mean amount of television watched by young men is greater than 50, when the mean is really greater than 50.
0 The researcher concludes that the true mean amount of television watched by young men is equal to 50, when the mean is really less than 50.
(7.) The researcher concludes that the mean amount of television watched by young men is greater than 50, when the mean is really less than or equal to 50.
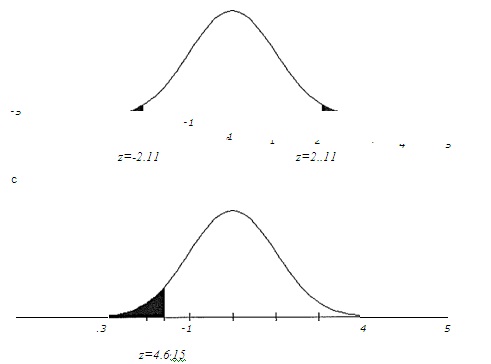
QUESTION 10 A researcher wants to study sports-watching behavior of young men. In a random sample of 18 young adult men 20-30 years old, each person was asked how many minutes of sports he watched on TV daily. The researcher wishes to test whether the mean amount of television watched daily by young men is greater than 50 minutes at the 0.05 level of significance.
Which of the following graphs correctly shows the rejection region?
d
-5
-1
01
1 2 -
4 5
c z=-2.11 z=2..11
-5 .3 -1 4 5
z=4.6,15
e
b
0 a
QUESTION 11 A researcher wishes to test the hypothesis that the mean age at first marriage for women in Texas is less than 21.3. In a sample of 57 Texas women, he finds that the average age is 22.2 with a standard deviation of 4.2.
Calculate the test statistic to two decimal places.
QUESTION 12 The manufacturer of Twitchy Energy Drink is doing a quality inspection to make sure that the caffeine content of the drink is meeting specifications of 79.8 mg per can. Suppose a quality inspector takes a sample of size 14 from the production line and finds that the average caffeine content in the sample is 78.2 mg, with a standard deviation of 0.49 mg.
Calculate the test statistic for testing the hypothesis that the true mean caffeine content is less than 79.8 mg per can, to two decimal places.
QUESTION 13 Dr. Mack Lemore, an expert in consumer behavior, wants to estimate the average amount of money that people spend in thrift shops. He takes a small sample of 8 individuals and asks them to report how much money they had in their pockets the last time they went shopping at a thrift store. Here is the data:
24, 20, 29, 18, 19, 24, 20, 24.
He wishes to test the null hypothesis that the average amount of money people have in their pockets is equal to $20. Calculate the test statistic to two decimal places.
QUESTION 14 How does hypothesis testing differ from constructing confidence intervals, in general? Read carefully.
a hypothesis test examines the evidence in the data for a specified value of the parameter chosen by the researcher, with the probability of making a Type 1 error equal to CC , A confidence interval gives a range of
"reasonable" values for a parameter, and therefore is never wrong.
6 a hypothesis test requires fewer assumptions than a confidence interval, and is also more accurate, for any choice of OC .
a hypothesis test gives a range of "reasonable" values for the parameter based on a specific set of data, while a confidence interval examines the evidence in the data for a specified value of the parameter chosen by the researcher.
0 a hypothesis test examines the evidence in the data for a specified value of the parameter chosen by the researcher, while a confidence interval gives a range of reasonable values for the parameter based on a specific set of data.
A hypothesis test leads to the right decision 50% of the time, while a confidence interval uses a method that is correct (1 - 00100% of the time (ex: 95% of the time).
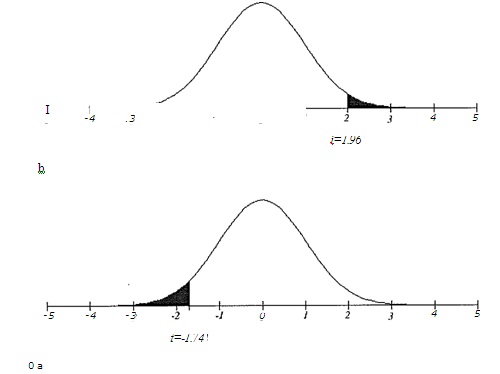
Suppose you are testing the following hypothesis
Ho :p=300 H1:p 300 You take a sample of size n = 13 and you set your type I error rate Oe = 0.01. Which of the following
diagrams correctly shows the critical region for this test, assuming the population standard deviation is unknown?
-3,0sr 3,05-s
650
(f)
a,S7C
QUESTION 16 A researcher wants to study sports-watching behavior of young men. In a random sample of 18 young
adult men 20-30 years old, each person was asked how many minutes of sports he watched on TV daily. The researcher wishes to test whether the mean amount of television watched daily by young men is greater than 50 minutes.
Which of the following is the correct specification of the alternative hypothesis?
m Hi:p >SO
• Hi:p>50
I-11:x <50
• I-11:p 50
kfo:50
QUESTION 17 The manufacturer of Twitchy Energy Drink is doing a quality inspection to make sure that the caffeine content of the drink is meeting specifications of 79.8 mg per can. Suppose a quality inspector takes a sample of size 11 from the production line and finds that the average caffeine content in the sample is 80 mg, with a standard deviation of 0.32 mg.
Calculate the test statistic for testing the hypothesis that the true mean caffeine content is less than 79.8 mg per can, to two decimal places.
QUESTION 18 A researcher wishes to test the hypothesis that the mean age at first marriage for women in Texas is less than 20. In a sample of 50 Texas women, he finds that the average age is 24.5 with a standard deviation of 4.4.
Calculate the test statistic to two decimal places.
QUESTION 19 Before the sub-prime mortgage crisis in late 2007, the mean selling price of a home in upstate New York was 191,300. A real estate agency wants to know if the price has changed since then. After examining a sample of 1,290 houses in the region in 2014, an analyst finds that the sample mean selling price was $155,936.09 with a standard deviation of $88,553.65, Calculate a 95% confidence interval for the true mean selling price of a home in 2014, to two decimal places, but report only the lower bound to answer this question.
QUESTION 20 Before the sub-prime mortgage crisis in late 2007, the mean selling price of a home in upstate New York was $191,300, A real estate agency wants to know if the price has changed since then. She intends to perform a hypothesis test at the 0.05 level of significance. However, you have already calculated the 95% confidence interval in the previous question. What, if anything, can you tell her about what the hypothesis test would show, based on this interval?
Read carefully.
• She would reject the null hypothesis because the value of $191,300 was in the interval. She would be able to conclude that the true mean selling price has changed since 2007.
a She would reject the null hypothesis because the value of $191,300 was not in the interval. She would conclude that the true mean selling price has decreased since 2007.
• She would fail to reject the null hypothesis because the value of $191,300 was in the interval. She would not be able to conclude that the true mean selling price has changed since 2007.
m She would reject the null hypothesis because the value of $191,300 was not in the interval, She would conclude that the true mean selling price has increased since 2007.
She would fail to reject the null hypothesis because the value of $191,300 was in the interval. She would be able to conclude that the true mean selling price has changed since 2007.
m She would fail to reject the null hypothesis because the value of $191,300 was in the interval. She would not be able to conclude that the true mean selling price has changed since 2007.