Reference no: EM131003420
PART A
Question 1:
a. The following frequency table shows the speeds (km/h) of a sample of cars travelling past a school crossing between 8:30 and 9:30 am on weekdays.
Speeds (km/h) Frequency
>20 up to and including 30 3
>30 up to and including 40 24
>40 up to and including 50 16
>50 up to and including 60 11
>60 up to and including 70 5
>70 up to and including 80 1
i. How many cars were sampled?
ii. What is the modal class for these data?
iii. Sketch a cumulative relative frequency polygon (an Ogive) for these data. Show all workings and the sketch in your answer booklet. Don't forget to label all axes and include an informative title.
iv. Calculate the mean and standard deviation speed travelled by these cars.
v. Why are the values for part iv. only approximations?
b. A lecturer was interested to compare the grades of students in three different tutorial classes with three different tutors. The boxplot showing the grade distribution for each of the three tutorial groups follows.
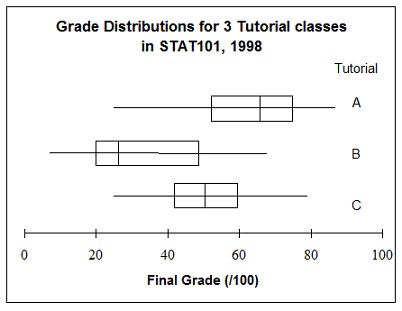
i. Which tutorial class had a grade distribution that was the closest to a normal distribution? How did you determine this?
ii. The overall pass mark for the subject was a final grade of 50/100 and 75% of all students enrolled passed. Was the performance of any of the above tutorial classes inconsistent with the performance of the group overall? Explain.
Question 2:
a. The time taken to install a new aircraft engine is a normally distributed random variable with a mean of 20 hours and a standard deviation of 1 hour.
i. What is the probability that the next installation takes between 17 and 18 hours?
ii. What is the probability that the next installation takes more than 16.5 hours?
iii. A random sample of 10 engines is selected. What is the probability that the mean time to install the engines is below 19.5 hours?
b. The standard medical treatment for a certain disease is successful in 60% of all cases. The treatment is given to 20 patients.
i. Let X = the random variable of interest for this problem. Define X.
ii. What type of random variable is X?
iii. What is the probability that the treatment is successful for less than 10 of the patients?
iv. What is the probability that the treatment is successful for 14 or more of the patients?
Question 3:
a. A company is considering installing a fax machine at one of its offices. As part of the decision process as to whether to install the machine, the company's manager wants to estimate the average number of documents that would be transmitted daily if the machine were installed. From experience at other offices, the company manager believes the standard deviation of the number of documents sent daily is 32. The manager also believes the number of documents transmitted daily is a normally distributed random variable. The machine is tested over a random sample of 15 days, and the resulting sample mean is 267.
i. Find a 99% confidence interval estimate for the average number of documents that would be transmitted daily if the machine were installed.
ii. Suppose the manager decides to install the machine if she could be fairly confident that the average number of documents transmitted daily would be above 245. Do the findings in part i. justify installing the machine? Explain.
b. The average total daily sales at a small supermarket are known to be $4528. The store's management recently implemented some changes in displays of goods, order within aisles and other changes, and management now wants to know whether the average sales volume has changed. A random sample of 12 days shows the average sales to be $5019 with a standard deviation of $630. If sales volume is known to be normally distributed, test whether there has been a significant change in sales volume. Use α = 0.05.
c. Ron Jones, the general manager of the National Paper Company, wants to determine the mean diameter of pine trees on land that is being considered for purchase. Past data suggests that the standard deviation of the trees on this land is 6.35 cm. If Ron wants to estimate the mean diameter to within 1 cm with 95% confidence, how many trees should be included in the sample?
Question 4:
a. The manager of a retail business suspects that people other than customers are using the store's carpark. She wants to test, at a significance level of whether cars in the carpark are typically parked for less than an hour, as those of customers would be. A random sample of 50 cars shows a mean parking time of 65 minutes, with a standard deviation of 21 minutes. Make the test.
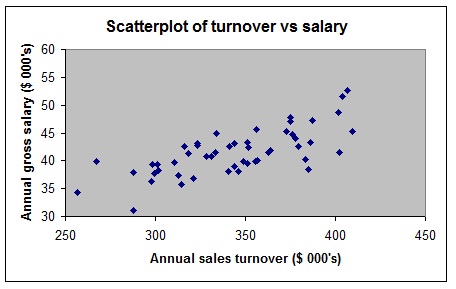
b. A sample of used car salespeople was taken and their Annual gross salary ($000's) and Annual sales turnover ($000's) recorded. A simple linear regression analysis was performed and the following Excel output generated.
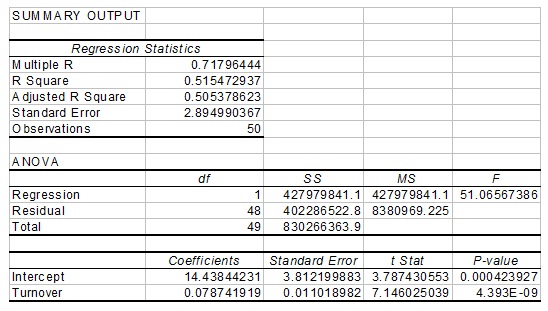
i. What is the equation for the relationship between turnover and salary?
ii. What is the increase in gross salary for a one thousand dollar increase in sales turnover?
iii. What is the annual salary of a salesperson who sells no cars?
iv. What is the predicted annual salary of a salesperson whose annual sales turnover is $450 000?
v. Find the 95% prediction interval for the annual gross salary of a salesperson whose turnover is $450 000 in a year? These values may be of assistance,
vi. Is the relationship between gross salary and sales turnover significant? Use a significance level of 0.01.
PART B:
100 people in a regional town were surveyed. They were asked whether they agreed with a new development which was being proposed for the main business area. The results of this survey were presented in graphical form. Use the following graph to answer questions 1. through 3. inclusive.
Results of a survey re a new development
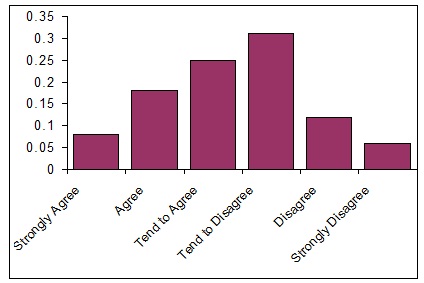
1. A suitable label for the vertical axis would be
A. Midpoints.
B. Frequency.
C. Relative frequency.
D. Number of people.
E. Height.
2. The distribution is
A. multimodal.
B. bimodal.
C. peaked.
D. approximately normal.
E. unimodal.
3. The variable displayed is measured at which of the following levels
A. Nominal.
B. Ordinal.
C. Interval.
D. Ratio.
E. Continuous.
4. A component bar chart should be used if the aim is to
A. compare relative frequencies.
B. compare raw frequencies.
C. compare cumulative frequencies.
D. compare subjective frequencies.
E. calculate the mean and standard deviation.
5. When a distribution is skewed to the right, which of the following statements is most correct?
A. median < mean.
B. mode = median.
C. The median a better descriptor of central tendency.
D. All of the above.
E. A. and C. above.
6. When quoting average house prices, the median is generally quoted instead of the mean. This is because
A. the median is simpler to calculate.
B. the median is always close to the mean anyway.
C. house prices are usually from a negatively skewed distribution.
D. all of the above.
E. none of the above.
7. Given that z is the standard normal random variable find P(z > -1.24)
A. 0.3925
B. 0.1075
C. 0.8925
D. 0.6075
E. 0.7850
Use the following information to answer questions 8. and 9.
An investment analyst collects data on stocks, and notes whether or not dividends were paid and whether or not the stocks increased in price over a given period. Data are presented in the following table.
Price increase No price increase Total
Dividends paid 34 78 112
No dividends paid 85 53 138
Total 119 131 250
8. If a stock is selected at random, what is the probability that it both increased in price and paid dividends?
A. 0.136
B. 0.286
C. 0.304
D. 0.476
E. 0.924
9. Given that a stock has increased in price, what is the probability that it also paid dividends?
A. 0.136
B. 0.286
C. 0.304
D. 0.476
E. 0.924
10. If P(A) = 0.25 and P(B) =0.65, then P(A and B) is
A. 0.1625
B. 0.25
C. 0.40
D. 0.90
E. unable to be determined due to insufficient information.
11. The number of accidents that occur weekly on a busy stretch of highway is an example of
A. a continuous probability distribution.
B. a discrete probability distribution.
C. a Poisson probability distribution.
D. a continuous random variable.
E. a discrete random variable.
12. Given that z is the standard normal random variable, what is the value of z if the area to the right of z is 0.1949?
A. 0.51
B. -0.51
C. 0.86
D. -0.86
E. unable to be determined due to insufficient information.
13. A news television programme asks viewers to phone or fax in their agreement/disagreement with the expulsion of school pupils for using an illegal substance at school. Suppose that the television station received 10 000 replies. Which of the following is true?
A. The 10 000 replies represents a large random sample.
B. The large sample will provide results that are representative of the population.
C. The results are likely to be biased.
D. All of the above.
E. None of the above.
Use the following information to answer questions 14. and 15.
The owner of a manufacturing company claims that 30% of its employees earn more than $40 000 pa. The employees dispute this, arguing that the proportion is in fact much less than this.
14. The appropriate hypotheses to test this claim would be
A. Ho : p = 0.30 HA : p ≠ 0.30
B. Ho : p = 0.30 HA : p < 0.30
C. Ho : p = 0.30 HA : p > 0.30
D. Ho : μ = $40 000 HA : μ > $40 000
E. Ho : μ ≥ $40 000 HA : μ < $40 000
15. A random sample of 30 employees were selected, 8 were found to have an income which exceeded $40 000. The appropriate hypothesis test was performed using Excel and the following output generated.
Test of Hypothesis About p
Test of p = 0.3 Vs p less than 0.3
Sample Proportion = 0.2667
Test Statistic = -0.3984
P-Value = 0.3452
Use the output provided to determine which of the following statements is correct at a 5% level of significance.
A. Reject Ho since p-value < 0.05
B. Reject Ho since zsample < -1.645
C. Reject Ho since zsample > 1.96
D. Do not reject Ho since p-value < 0.5
E. Do not reject Ho since zsample > 1.645
16. Which of the following statements about the correlation coefficient between x and y is true?
A. It detects whether y is caused by x.
B. It provides a measure of the linear association between y and x.
C. It tells us how much y increases for a unit increase in x.
D. It allows the response variable y to be predicted from the explanatory variable x.
E. It tells us how well the regression line fits the data.
17. The least squares method for fitting a regression line minimises the
A. standard deviation.
B. residual sum of squares.
C. sum of squares of fitted values.
D. sum of absolute deviations between actual and fitted values.
E. value of the slope.
18. In regression, a residual is defined as
A. the horizontal distance between a point and the regression line.
B. the distance between consecutive points on the scatterplot.
C. the variation you would expect if you fitted another variable.
D. the vertical distance between a point and the regression line.
E. none of the above.
19. From a regression analysis of a response variable on a single explanatory variable, a plot of residuals against fitted values follows.
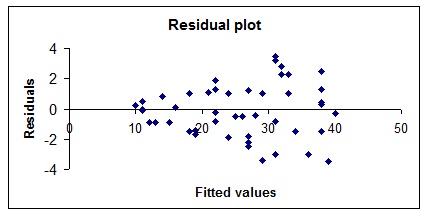
This plot tells you
A. there is no relationship between the two variables.
B. the relationship is not linear.
C. the wrong explanatory variable has been used.
D. the constant variation assumption does not hold.
E. a mistake has been made in the analysis.
20. We want to predict sales of a product from orders taken. A straight line regression is fitted, with sales as the response variable and orders taken as the explanatory variable. Which of the following statements is false?
A. It is dangerous to use a regression line to predict sales when the number of orders is outside the range of values used to fit the line.
B. The intercept in the regression equation is the value of orders when sales is equal to zero.
C. A non linear relationship between sales and orders taken can be detected from a plot of residuals against fitted values.
D. A. and C. are both false.
E. B. and C. are both false.