Reference no: EM131003895
PART A:
Question 1:
In many manufacturing processes there is a term called work in progress (often abbreviated WIP). In a book manufacturing plant this represents the time it takes for sheets from a press to be folded, gathered, sewn, tipped, and bound. The following data represent samples of 20 books at each of two production plants and the processing time (operationally defined as the time in days from when the books came off the press to when they were packed in cartons) for these jobs.
Plant A
4.42 5.29 5.41 5.62 7.29 7.50 7.54 7.58 7.96 8.45
8.58 8.92 9.29 10.50 10.92 11.42 11.46 11.62 16.25 21.62
Plant B
9.54 11.46 16.62 12.62 25.75 15.41 14.29 13.13 13.71 10.01
5.75 12.46 9.17 13.21 6.00 2.33 14.25 5.37 6.25 9.71
a. Find the mean and standard deviation processing times for Plant A.
b. Determine the median and mode processing times for Plant A.
Use your answers from a. - b. above together with the output following to answer question c. and d.
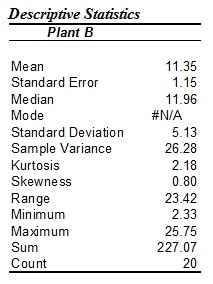
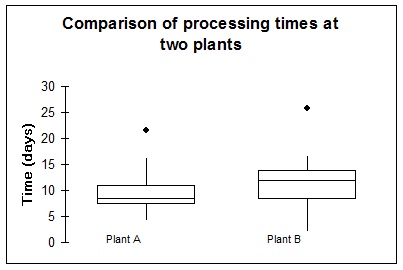
c. Are the processing times at Plant A and Plant B skewed? If so, in which direction? Explain how you reached your conclusions by referring to your answers in a. and b. above and the MS Excel output provided.
d. On the basis of the results in a. - c. above and the MS Excel output provided, are there any differences in the processing times at the two plants. Explain.
e. In the Descriptive Statistics table for Plant B, explain the meaning of #N/A for the mode.
f. In the Descriptive Statistics table for Plant B, how is the value for the standard error obtained?
Question 2:
a. A survey of a magazine's subscribers indicates that 60% own a home and 75% own a car. Ninety percent of the home owners who subscribe to the magazine, also own a car. What proportion of subscribers
i. own both a car and a house?
ii. own a car or a house?
iii. own neither a car nor a house?
b. A certain brand of flood lamps has a length of life that is normally distributed with a mean of 3500 hours and a standard deviation of 200 hours.
i. What proportion of these lamps will last for more than 4000 hours?
ii. What length of life should the manufacturers advertise for these lamps in order that only 3% of the lamps will burn out before the advertised length of life?
c. An advertisement claims that two out of five doctors recommend a certain pharmaceutical product. A random sample of 20 doctors is selected, and it is fond that only two of them recommend the product.
i. Assuming the advertising claim is true, what is the probability of the observed event ie only two doctors recommending the product?
ii. Assuming the claim is true, what is the probability of two or fewer doctors recommending the product?
iii. Given the results in i. and ii. above, do you believe the advertisement? Explain.
Question 3:
a. A survey of 100 retailers revealed that the mean after-tax profit was $75 000. We assume that the population standard deviation is $20 000,
i. Find the 99% confidence interval estimate of the mean after-tax profit for all retailers.
ii. If we wish to estimate the mean after-tax profit with 99% confidence and to within $4 000, how many additional retailers would need to be surveyed?
b. A statistician hires a company to input survey data onto a computer. The company claims that the error rate is less than 0.1%. To test the claim the statistician examines 10 000 numbers and discovers that three are incorrect. Do these results support the company's claim? Test with α = 0.01.
Question 4:
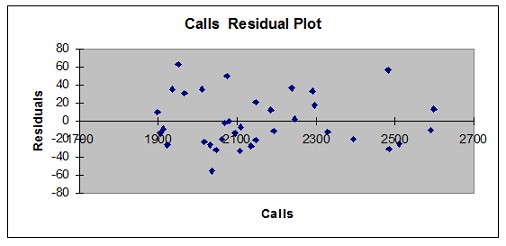
a. A brokerage would like to be able to predict the number of trade executions per day and has decided to use the number of incoming phone calls as a predictor variable. Data were collected over a period of 35 days. The data were plotted using MS Excel and the scatterplot follows.
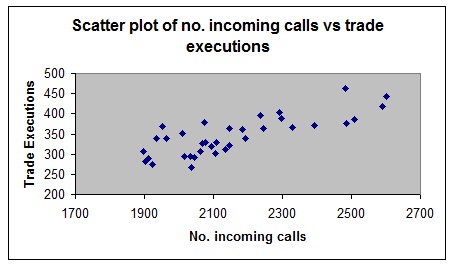
i. Comment on the apparent relationship between trade executions and the number of incoming phone calls as evident from the scatterplot.
MS Excel has been used to fit a simple linear regression. The output produced by MS Excel follows.
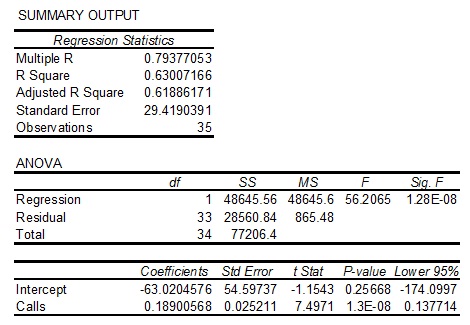
ii. State the regression equation, expressing each coefficient to 2 decimal places
iii. Interpret the meaning of the slope coefficient in this problem.
iv. Use the regression equation, stated in ii. above to predict the average number of trades executed for a day in which the number of incoming calls is 2000.
v. Would it be appropriate to use the model to predict the average number of trades executed for a day in which the number of incoming calls is 5000? Explain.
vi. Given for the number of incoming calls, calculate a 95% confidence interval estimate of the average number of trades executed for days in which the number of incoming calls is 2000.
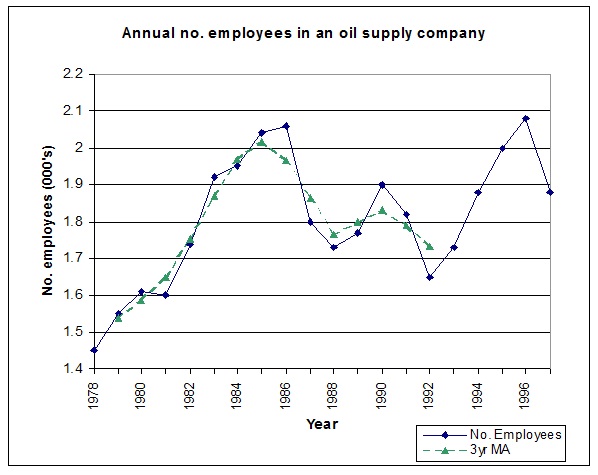
b. The following data represent the annual number of employees (in thousands) for an oil supply company for the years 1978 - 1997.
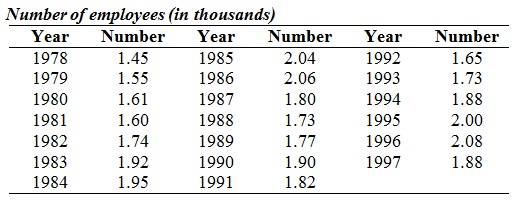
i. If the data is smoothed using a 3-year moving average, find these moving averages for 1993 - 1996.
ii. Can we calculate a 3-year moving average for 1997? Explain.
iii. The original data together with the smoothed data have been plotted in the graph below. The graph of the moving averages is incomplete. Plot the 3-year moving averages for 1993 - 1996 calculated in i. above, on the graph below.
PART B:
1. A researcher has collected the following sample data. The mean of the sample is 5.
3 5 12 3 2
The coefficient of variation is
A. 0.727
B. 0.812
C. 2.640
D. 3.300
E. 0.264
2. Information was obtained from students as they left the University Coop bookshop during the first week of classes. Which of the following variables would be classified as ratio data.
A. The course being studied.
B. The type of computer owned by the student
C. The amount of money spent on books.
D. The method of payment.
E. The students progress through the course ie 1st year, 2nd year, etc.
3. Which of the following measures of spread (dispersion) is least affected by the presence of extreme (outlying) values?
A. Variance
B. Range
C. Median
D. Interquartile range
E. Standard deviation
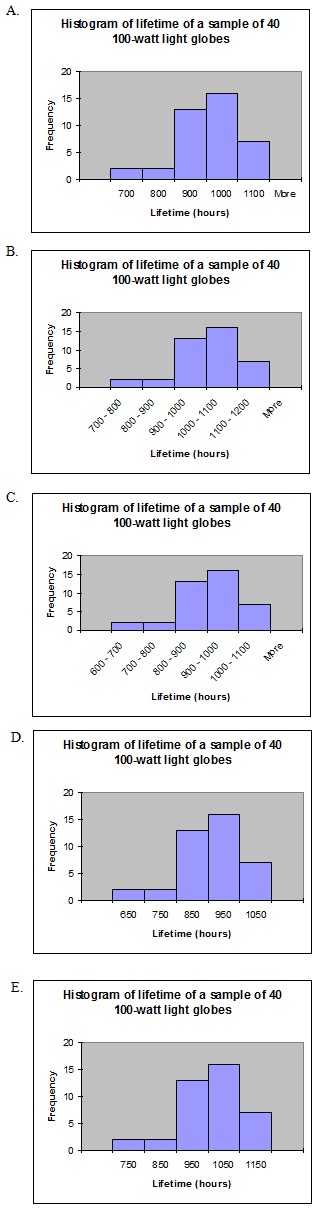
4. The lifetimes of a sample of 40, 100-watt light globes were organised into the following frequency distribution using MS Excel.
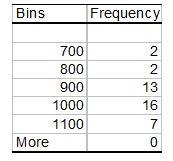
The histogram which most correctly represents this data is given by
5. The reason why the standard deviation of a distribution is more easily interpreted than the variance is that
A. it is a measure of average deviation.
B. it is expressed in the same units as the data.
C. it takes every data value into account.
D. it is standardised.
E. it takes the mean into account.
Use the following information to answer questions 6. and 7.
An advertising executive receives an average of 10 phone calls each afternoon between 2pm and 4pm. The calls occur randomly and independently of one another.
6. Find the probability that the executive will receive at least three calls between 2pm and 4pm on a particular afternoon.
A. 0.997
B. 0.003
C. 0.010
D. 0.007
E. 0.990
7. Find the probability that the executive will receive 12 calls between 2pm and 3pm on a particular afternoon.
A. 0.792
B. 0.095
C. 0.998
D. 0.003
E. 0.995
8. If Z is a standard normal random variable, find P(Z ≥ 1.84)
A. 0.9671
B. 0.5329
C. 0.4671
D. 0.0500
E. 0.0329
9. If P(A) = 0.4, P(B) = 0.6 and P(B|A) = 0.75 then P(A ∩ B) is
A. 0.45
B. 0.53
C. 0.80
D. 0.24
E. 0.30
10. Consider the process of tossing a fair coin 6 times. Which of the following sequences of tosses is more likely to occur?
A. THTHHT
B. HHHTTT
C. HHHHHH
D. TTHHTH
E. They are all equally likely.
11. The amount of time a person is required to wait for an elevator in a large department store is uniformly distributed with a range of waiting time from no wait (0 seconds) to 3 minutes and 30 seconds wait. A recent study in consumer behaviour suggests that if customers are required to wait more than two minutes and 45 seconds, they develop negative impressions of the commitment of the store to customer service. Based on this study, what proportion of customers using the department store's elevator are likely to develop negative impressions of the store's commitment to customer service?
A. 31.25%
B. 68.75%
C. 21.43%
D. 25.76%
E. 78.57%
12. A population has a mean of 53 and a standard deviation of 21. A sample of 49 observations will be taken. The probability that the sample mean will be less than 57.95 is:
A. 0.0948
B. 0.0495
C. 0.4505
D. 0.9505
E. 0.5948
13. A random sample of 25 students were found to have an average age of 25 years with a standard deviation of two years. The 90% confidence interval for the true age of students is calculated using
A. x‾ ± t25,0.1(0.4)
B. x‾ ± t25,0.05(0.4)
C. x‾ ± t24,0.1(0.4)
D. x‾ ± t24,0.05(0.4)
E. x‾ ± Z0.05(0.4)
14. A human resources manager stated that after sampling he could report the standard error of response times to service calls to be 20 minutes. Given that the variance of response times to calls is known to be 40 000 minutes, find the size of the sample taken.
A. 10
B. 100
C. 25
D. 2000
E. 4 000 000
15. Given the same sample mean and variance, which of the following would give the widest confidence interval for the population mean?
A. A 95% confidence interval with n = 36.
B. A 95% confidence interval with n = 100.
C. A 99% confidence interval with n = 36.
D. A 99% confidence interval with n = 100.
E. All the above intervals would have the same width.
16. The residuals formed when a regression line is fitted to a data set should ideally
A. be normally distributed.
B. have an expected value of zero.
C. have a variance which is independent of the value of the independent variable.
D. be independent from each other.
E. possess all the characteristics of A., B., C. and D.
17. A car rental agency wants to determine the correlation between monthly maintenance costs and the distance travelled by their smaller cars. Data on 15 randomly selected cars were plotted in the graph following.
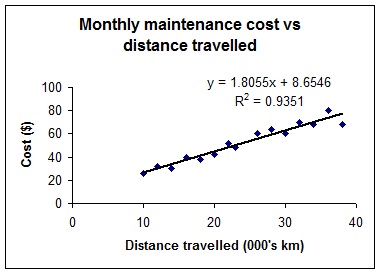
From the information provided in the graph, the sample correlation coefficient measuring the correlation between maintenance costs and distance travelled is
A. 0.97
B. 0.87
C. 0.94
D. -0.97
E. unable to be determined from the information provided.
18. Consider the following set of seasonal-irregular component values for a quarterly time series.
Quarter 1 Quarter 2 Quarter 3 Quarter 4
1.102 0.938 0.933 1.009
1.064 1.007 0.901 1.075
1.139 0.979 0.905 0.950
The seasonal index for the third quarter would be
A. 0.993
B. 0.996
C. 2.739
D. 1.000
E. 0.913
19. The following seasonal indices and trend line were computed from five years of quarterly sales data. Forecast the sales for the second quarter of the sixth year.
yˆ = 500 + 30t (t = 1, 2, 3, ....., 20)
Quarter Seasonal index
1 1.4
2 1.2
3 0.9
4 0.5
A. 1130
B. 1356
C. 1392
D. 1160
E. 1582
20. The data in the following table represent weekly sales (in thousands) for computer disks. Exponentially smoothed sales data (w = 0.4) are also shown however the value for week 5 is missing.
Week Sales (000's) Sales (000's) (w = 0.4)
1 57 57.0
2 58 57.4
3 60 58.4
4 54 56.7
5 56
The exponentially smoothed value for week 5 would be
A. 56.0
B. 56.4
C. 55.6
D. 56.3
E. 56.7