Reference no: EM131070380
Question 1. The properties of convolution is listed in the table 1; Verify the properties of convolution for the given signal by:
x[n] = n{u[n-10] - u[n+15]}
h[n] = (0.5)n {u[n] - u[n-10] }
h1 [n] = cos(0.05πn) {u[n]-u[n-21] }
h2 [n] = 2δ[n+3] + δ[n-1] - 3δ[n-5]
(a) Numerical computation of convolution sum.
(b) Verify the result obtained in part(a) by using MATLAB function convand plot the output of each property.
Question 2. The pole - zero diagram in figure 2 corresponds to the Z-transform [X(z)] of a causal sequence (x[n] ). Sketch the pole-zero diagram of Y(z), where y[n]=x[-n+5]. Also, determine the region of convergence for Y(z).
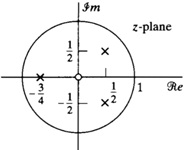
Figure 2
b) Discuss the applications of Multirate Digital Signal processing or Explain the need of Multirate Signal Processing with suitable Example.
Question 3. Given the realization of IIr filter in Figure 3.
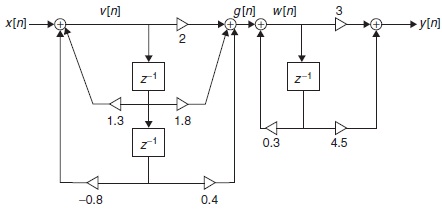
Figure 3
a) Obtain the difference equation relating g[n]to x[n] and g[n] to y[n].
b) Determine the transfer function H(z)for the filter.
Question 4. In this problem use Lena image to compute the output.
a) Load the Lena image in MATLAB and display using imshow function.
b) Consider the 1D (single dimensional) impulse response h[n]=1/5 {(1,1,1,↑1,1)}. Using it perform 1D convolution along the each row of the Lena image and display the resulting blurred image. Comment on the result.
c) Using the image obtained in part (b) perform 1D convolution along the each column of the Lena image and display the resulting blurred image. Compare this image with the image in part (b) and comment on the results.
Discuss the applications of Multirate Digital Signal processing or Explain the need of Multirate Signal Processing with suitable
|
T-test statistics and descriptive statistics
: This assignment is designed to give you the opportunity to practice using Microsoft Excel to compute a t-test and to reinforce your learning of computing descriptive statistics from a previous module.
|
|
Weight of a plastic sphere of mass
: What is the magnitude of a the vertical electric field that will balance the weight of a plastic sphere of mass that has been charged to -3.0 nC? (k = 1/4πε0 = 9.0 × 10⁹ N · m2/C2)
|
|
What do the terms inverting and non-inverting mean
: Calculate the ideal IT, IE,Vc for the differential amplifier shown in the diagram. Repeat the calculations using the second approximation. Show all work and record the final answers in the table.
|
|
Right thickness for canceling red light
: Suppose the thickness of an oil film on water is just the right thickness for canceling red light. what color would your eye see? Why?
|
|
Applications of multirate digital signal processing
: ELEC 0316-SPRING - Discuss the applications of Multirate Digital Signal processing or Explain the need of Multirate Signal Processing with suitable Example.
|
|
Evaluate the issue in terms of its microeconomic implication
: ECO503-ECONOMIC STATISTICS. Critically evaluate the issue in terms of its microeconomic implication in reference to consumers and businesses. Clearly highlight the current and future response strategies of affected parties
|
|
Unemployment regulations and benefits
: Paper viewpoint: Unemployment regulations and benefits should be changed for at least these following reasons:-Lax regulations for time limits, leading to unending benefits or secondary welfare system
|
|
Computing the mass of the second car
: A 9500 kg car traveling at 16 m/s strikes a second car. The two cars stick together and move off with a speed of 6.0 m/s. What is the mass of the second car?
|
|
Conservation of momentum of momentum
: Can conservation of momentum of momentum relate to action reaction force rule? Explain why.
|